Note: Your data administrator determines
what data sources you are authorized to view.
Data source reports
are ad hoc reports that use either a list table or a crosstabulation
table depending on the type of data. The following table shows the
different data sources and the type of table that is used for an ad
hoc report.
|
|
|
Relational information
map
|
|
A summarized list table
that is based on a system default query or a default query that is
set up by your data administrator
|
Multidimensional information
map
|
|
A crosstabulation table
that is based on a system default query or a default query that is
set up by your data administrator
|
|
|
A detailed list table
including all underlying columns 1
|
|
|
A crosstabulation table
that is based on a system default query
|
1When detail data is used,
you cannot insert a crosstabulation table or any graphs except for
scatter and bubble plots. To use a crosstabulation table and the other
graph types, select Data Summarization Options in Edit
mode, and select the Summarize similar rows (Aggregated
data) option.
|
To open a data source
directly, complete these steps:
-
Double-click an information
map, table, or cube in the
Open dialog box.
The ad hoc report opens in View mode.
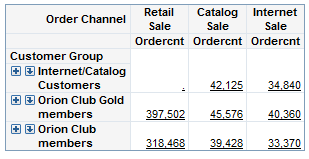
Example of a Data Source Report Based on a Multidimensional
Information Map
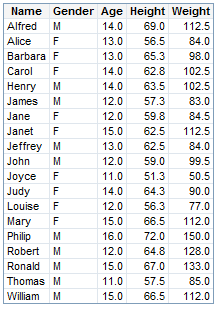
Example of a Data Source Report Based on a Table
-
Select
FileSave.
For information about
how to complete the Save As dialog box, see Save a Report.