Overview of the Report Mode Interfaces
Your role and the associated capabilities determine
the report mode, as well as which features you can access in SAS Web
Report Studio. For example, report viewers do not have the ability
to access Edit mode. For more information about capabilities, see Managing Access to SAS Web Report Studio.
View Mode Interface
This is the mode that
all SAS Web Report Studio users can see. View mode displays the output
of a saved report. Users who are authorized to create and edit reports
can also use View mode to preview new, unsaved reports.
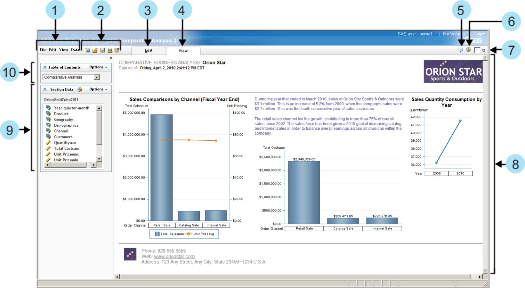
The following figure
is an example of a report displayed in View mode. The report contains
query results from a multidimensional data source. The main features
of this specific report and the View tab
are identified.
The View Mode Interface

| 1 | Select the File, View, or Data menu items to access options that apply to the entire report or to the currently displayed report section, including the objects in the section. |
| 2 | Use these icons to create a new report, open an existing report, save the current report, print the current report, or export the current report. |
| 3 | Authorized users can click the Edit tab to open the viewed report in Edit mode. |
| 4 | The View tab is on top when View mode is active. |
| 5 | This icon indicates that one or more comments are associated with the report. |
| 6 | This icon indicates that the objects in this report section are synchronized. |
| 7 | This
navigational box indicates the section that you are editing, as well
as the total number of sections in the report. To view a different
section, either enter a number in the box or select View |
| 8 | The body contains the report. |
| 9 | Use the Section Data panel to select data and to view an indicator of whether objects are synchronized. This panel can be collapsed horizontally. |
| 10 | Use the Table of Contents panel to work with both sections and group breaks. This panel can be collapsed horizontally. |
Edit Mode Interface
Authorized users can
access the Edit tab to create new reports
or to edit existing reports. Note that some options in Edit mode are
not available for reports and stored processes that come from SAS
Enterprise Guide. The available options in Edit mode also depend on
the type of report that you are editing.
The Edit Mode Interface

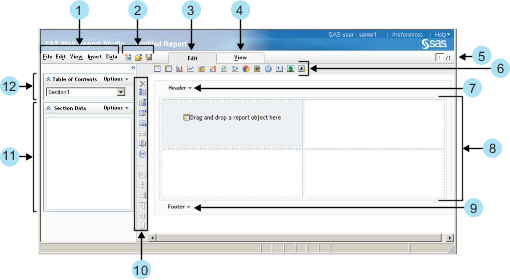
| 1 | Select the File, Edit, View, Insert, or Data menu items to access options that apply to the entire report or to the currently displayed report section, including the objects in the section. |
| 2 | Use these icons to create a new report, open an existing report, or save the current report. |
| 3 | The Edit tab is on top when Edit mode is active. |
| 4 | Click View when you are ready to view the report. |
| 5 | This
navigational box indicates the section that you are editing, as well
as the total number of sections in the report. To view a different
section, either enter a number in the box or select View |
| 6 | Use this horizontal toolbar to insert objects (such as tables, graphs, geographical maps, stored processes, text, and images). |
| 7 | Click Header to enter header information for the report section. For more information, see Designing Headers and Footers. |
| 8 | The
body of the report section consists of a grid for arranging objects
such as tables, graphs, and images, and two toolbars (one above the
grid and one to the left of the grid). For more information,
see Overview of Positioning Report Objects.
The body of the report
can also include stored process objects that are used to obtain data
and layout information for the report section.
|
| 9 | Click Footer to enter footer information for the report section. For more information, see Designing Headers and Footers. |
| 10 | Use
the Section Data panel to select data and
to specify whether objects are synchronized. This panel can be collapsed
horizontally. An Options menu enables you
to select data and to specify whether the objects are synchronized.
You can also work with section filters. The Section Filters menu
option is always available for relational data. The option is available
for multidimensional data only if the filters were predefined in SAS
Information Map Studio.
After you select the
data items, a context menu is available. Depending on the type of
data source, you can use this menu to specify the format and data
item properties. You might also be able to select or define filters
and change the default format.
For more information
about defining a query that uses data items, see Defining Queries to Obtain Results.
|
| 11 | Use this vertical toolbar to delete and align objects and to merge, split, and add cells to the layout grid. |
| 12 | Use
the Table of Contents panel to work with
sections and to switch between sections. Use the Options menu
to add new sections and rename, delete, or reorder existing sections.
This panel can be collapsed horizontally. For more information,
see The SAS Web Report Studio Interface. If you select data items
from a data source to define a query for the report section, then
you might be able to specify group breaks for the report section. For more information,
see Grouping Query Results.
|
