To specify a generic cashflow, you merely define any sequence of date-amount pairs. The flexibility of generic cashflows enables the user to represent economic alternatives or investments that do not fit into loan, savings, depreciation, or bond specifications.
In the Investment Analysis dialog box, select Investment ![]() New
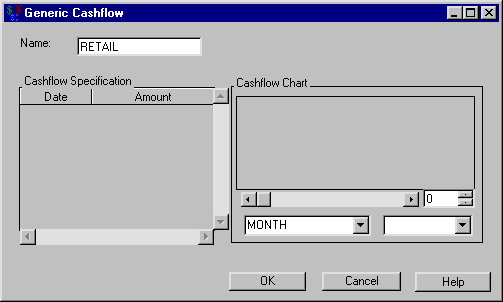
New ![]() Generic Cashflow from the menu bar to open the Generic Cashflow dialog box. Enter
Generic Cashflow from the menu bar to open the Generic Cashflow dialog box. Enter RETAIL for the Name as in Figure 55.17.
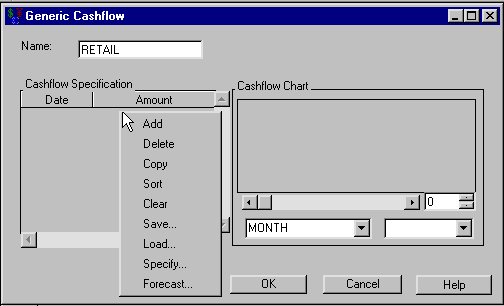
Right-clicking within Generic Cashflow’s Cashflow Specification area reveals the pop-up menu displayed in Figure 55.18. The menu provides many useful tools to assist you in creating these date-amount pairs.
The following sections describe how to use most of these right-click options. The Specify and Forecast menu items are described in the sections Including a Generated Cashflow and Including a Forecasted Cashflow.
To add a new date-amount pair manually, follow these steps:
-
Right-click in the Cashflow Specification area as shown in Figure 55.18, and release on Add.
-
Enter
01JAN01for the date. -
Enter 100 for the amount.
To copy a selected date-amount pair, follow these steps:
-
Select the pair you just created.
-
Right-click in the Cashflow Specification area as shown in Figure 55.18, but this time release on Copy.
Change the second date to 01JAN00. Now the dates are unsorted. Right-click in the Cashflow Specification area as shown in Figure 55.18, and release on Sort.
To delete a selected date-amount pair, follow these steps:
-
Select a date-amount pair.
-
Right-click in the Cashflow Specification area as shown in Figure 55.18, and release on Delete.
To clear all date-amount pairs, right-click in the Cashflow Specification area as shown in Figure 55.18, and release on Clear.
To load date-amount pairs from a SAS data set into the Cashflow Specification area, follow these steps:
-
Right-click in the Cashflow Specification area, and release on Load. This opens the Load Dataset dialog box.
-
Enter
SASHELP.RETAILfor Dataset Name. -
Click OK to return to the Generic Cashflow dialog box.
If there is a Date variable in the SAS data set, Investment Analysis loads it into the list. If there is no date-time-formatted variable, it loads the first available date or date-time-formatted variable. Investment Analysis then searches the SAS data set for an Amount variable to use. If none exists, it takes the first numeric variable that is not used by the Date variable.
To save date-amount pairs from the Cashflow Specification area to a SAS data set, follow these steps:
-
Right-click in the Cashflow Specification area and release on Save. This opens the Save Dataset dialog box.
-
Enter the name of the SAS data set for Dataset Name.
-
Click OK to return to the Generic Cashflow dialog box.
To generate date-amount pairs for the Cashflow Specification area, follow these steps:
-
Right-click in the Cashflow Specification area and release on Specify. This opens the Flow Specification dialog box.
-
Select YEAR for the Time Interval.
-
Enter today’s date for the Starting Date.
-
Enter 10 for the Number of Periods. The Ending Date updates.
-
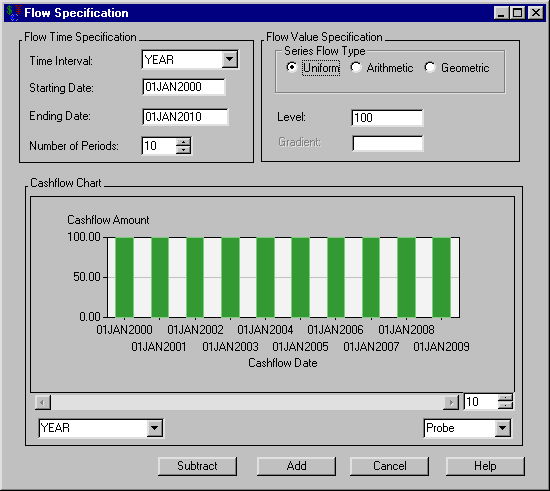
Enter 100 for the level. You can visualize the specification in the Cashflow Chart area (see Figure 55.19).
-
Click Add to add the specified cashflow to the list in the Generic Cashflow dialog box. Clicking Add also returns you to the Generic Cashflow dialog box.
Clicking Subtract subtracts the current cashflow from the Generic Cashflow dialog box, and it returns you to the Generic Cashflow dialog box.
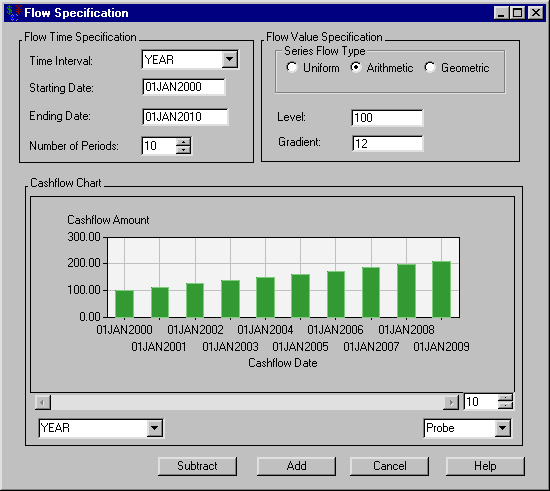
You can generate arithmetic and geometric specifications by clicking them within the Series Flow Type area. However, you must enter a value for the Gradient. In both cases the Level value is the value of the list at the Starting Date. With an arithmetic flow type, entries increment by the value Gradient for each Time Interval. With a geometric flow type, entries increase by the factor Gradient for each Time Interval. Figure 55.20 displays an arithmetic cashflow with a Level of 100 and a Gradient of 12.
To generate date-amount pairs for the Cashflow Specification area, follow these steps:
-
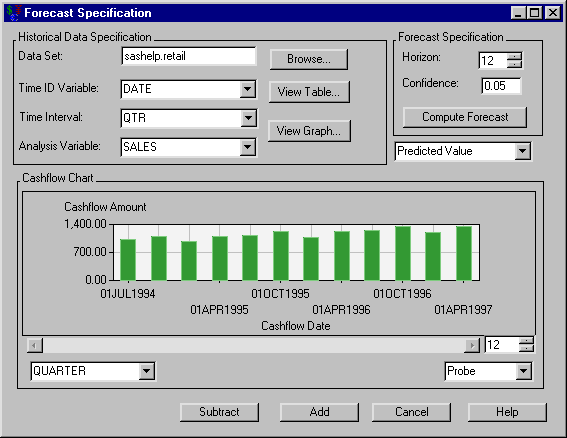
Right-click in the Cashflow Specification area and release on Forecast to open the Forecast Specification dialog box.
-
Enter
sashelp.retailas the Data Set. -
Select SALES for the Analysis Variable.
-
Click Compute Forecast to generate the forecast. You can visualize the forecast in the Cashflow Chart area (see Figure 55.21).
-
Click Add to add the forecast to the list in the Generic Cashflow dialog box. Clicking Add also returns you to the Generic Cashflow dialog box.
Clicking Subtract subtracts the current forecast from the Generic Cashflow dialog box, and it returns you to the Generic Cashflow dialog box.
To review the values from the SAS data set you forecast, click View Table or View Graph.
You can adjust the following values for the SAS data set you forecast: Time ID Variable, Time Interval, and Analysis Variable.
You can adjust the following values for the forecast: the Horizon, the Confidence, and choice of predicted value, lower confidence limit, and upper confidence limit.
Three dialog boxes contain the Cashflow Chart to aide in your visualization of cashflows: Generic Cashflow, Flow Specification, and Forecast Specification. Within this chart, you possess the following tools:
You can click on a bar in the plot and view its Cashflow Date and Cashflow Amount.
You can change the aggregation period of the view with the box in the lower-left corner of the Cashflow Chart. You can take the quarterly sales figures from the previous example, select YEAR as the value for this box, and view the annual sales figures. You can change the number in the box to the right of the horizontal scroll bar to alter the number of entries you want to view. The number in that box must be no greater than the number of entries in the cashflow list. Lessening this number has the effect of zooming in upon a portion of the cashflow. When the number is less than the number of entries in the cashflow list, you can use the scroll bar at the bottom of the chart to scroll through the chart.
