Analyses
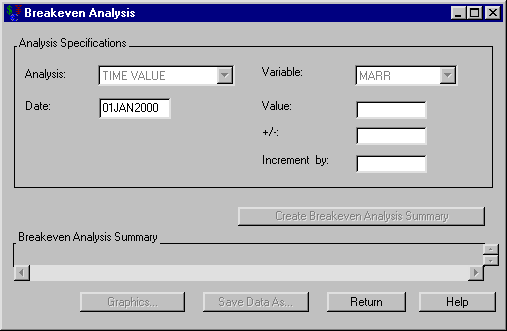
Having selected a generic cashflow from the Investment Analysis dialog box, to perform a breakeven analysis, select Analyze ![]() Breakeven Analysis from the Investment Analysis dialog box’s menu bar. This opens the Breakeven Analysis dialog box displayed in Figure 58.13.
Breakeven Analysis from the Investment Analysis dialog box’s menu bar. This opens the Breakeven Analysis dialog box displayed in Figure 58.13.
The following items are displayed:
Analysis Specification
-
Analysis holds the analysis type. Only Time Value is currently available.
-
Date holds the date for which you perform this analysis.
-
Variable holds the variable upon which the breakeven analysis will vary. Only MARR is currently available.
-
Value holds the desired rate upon which to center the analysis.
-
+/- holds the maximum deviation from the Value to consider.
-
Increment by holds the increment by which the analysis is calculated.
Create Breakeven Analysis Summary becomes available when you adequately specify the analysis. Clicking Create Breakeven Analysis Summary then fills the Breakeven Analysis Summary area.
Breakeven Analysis Summary fills when you click Create Breakeven Analysis Summary. The schedule contains a row for each MARR and date.
Graphics becomes available when you fill the Breakeven Analysis Summary area. Clicking it opens the Breakeven Graph graph representing the time value versus MARR.
Print becomes available when you fill the breakeven analysis summary. Clicking it sends the contents of the summary to the SAS session print device.
Save Data As becomes available when you generate the breakeven analysis summary. Clicking it opens the Save Output Dataset dialog box where you can save the summary (or portions thereof) as a SAS Dataset.
Return takes you back to the Investment Analysis dialog box.
