Computations
Having selected a generic cashflow from the Investment Analysis dialog box, to perform a constant dollar calculation, select
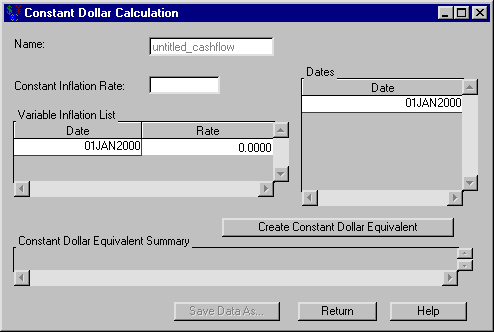
Compute ![]() Constant Dollars from the Investment Analysis dialog box’s menu bar. This opens the Constant Dollar Calculation dialog box displayed in Figure 57.10.
Constant Dollars from the Investment Analysis dialog box’s menu bar. This opens the Constant Dollar Calculation dialog box displayed in Figure 57.10.
The following items are displayed:
Name holds the name of the investment for which you are computing the constant dollars value.
Constant Inflation Rate holds the constant inflation rate (a percentage between 0% and 120%). This value is used if the Variable Inflation List area is empty.
Variable Inflation List holds date-rate pairs that describe how inflation varies over time. Each date is a SAS date, and the rate is a percentage between 0% and 120%. Each date refers to when that inflation rate begins. Right-clicking within the Variable Inflation area reveals many helpful tools for managing date-rate pairs. If you assume a fixed inflation rate, just insert that rate in Constant Rate.
Dates holds the SAS date(s) at which you wish to compute the constant dollar equivalent. Right-clicking within the Dates area reveals many helpful tools for managing date lists.
Create Constant Dollar Equivalent becomes available when you enter inflation rate information. Clicking it fills the constant dollar equivalent summary with the computed constant dollar values.
Constant Dollar Equivalent Summary fills with a summary when you click Create Constant Dollar Equivalent. The first column lists the dates of the generic cashflow. The second column contains the constant dollar equivalent of the original generic cashflow item of that date.
Print becomes available when you fill the constant dollar equivalent summary. Clicking it sends the contents of the summary to the SAS session print device.
Save Data As becomes available when you fill the constant dollar equivalent summary. Clicking it opens the Save Output Dataset dialog box where you can save the summary (or portions thereof) as a SAS Dataset.
Return returns you to the Investment Analysis dialog box.
