Investments
Suppose someone offers to sell you a 20-year utility bond that was issued six years ago. It has a $1,000 face value and pays semi-year coupons at 2%. You can purchase it for $780. Would you be satisfied with this bond if you expect an 8% minimum attractive rate of return (MARR)?
In the Investment Analysis dialog box, select Investment ![]() New
New ![]() Bond from the menu bar to open the Bond dialog box.
Bond from the menu bar to open the Bond dialog box.
To specify the bond, follow these steps:
-
Enter
UTILITY_BONDfor the Name. -
Enter 1000 for the Face Value.
-
Enter 2 for the Coupon Rate. The Coupon Payment updates to 20.
-
Select SEMIYEAR for Coupon Interval.
-
Enter 28 for the Number of Coupons. Because 14 years remain before the bond matures, the bond still has 28 semiyear coupons to pay. The Maturity Date updates.
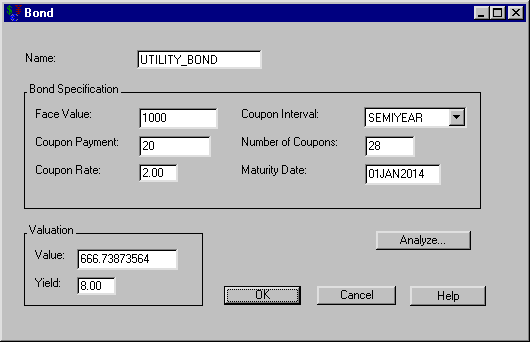
Enter 8 for Yield within the Valuation area. You see the bond’s value would be $666.72 as in Figure 56.13.
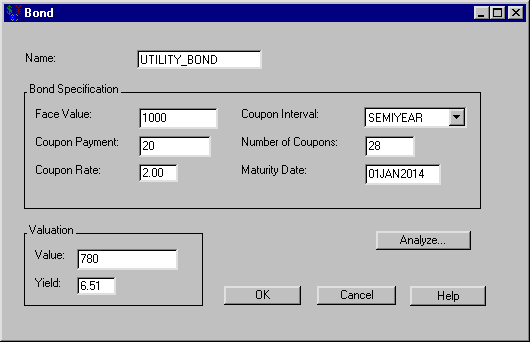
Now enter 780 for Value within the Valuation area. You see the yield is only 6.5%, as in Figure 56.14. This is not acceptable if you desire an 8% MARR.
To perform bond-pricing analysis, follow these steps:
-
Click Analyze to open the Bond Analysis dialog box.
-
Enter 8.0 as the Yield to Maturity.
-
Enter 4.0 as the +/-.
-
Enter 0.5 as the Increment by.
-
Enter 780 as the Reference Price.
-
Click Create Bond Valuation Summary.
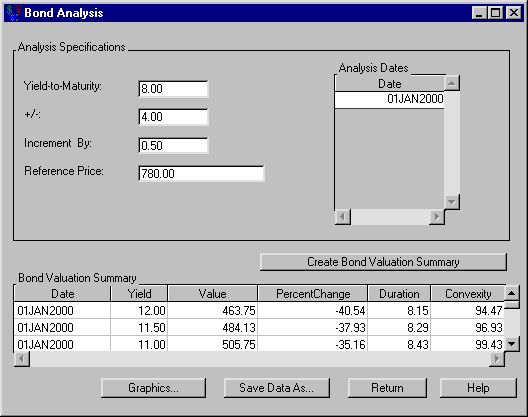
The Bond Valuation Summary area fills and shows you the different values for various yields as in Figure 56.15.
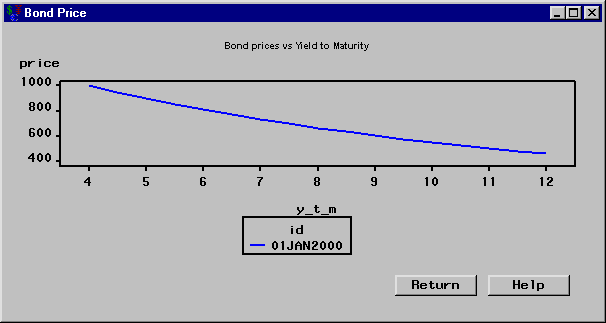
Click Graphics to open the Bond Price dialog box. This contains the price versus yield-to-maturity graph shown in Figure 56.16.
Click Return to return to the Bond Analysis dialog box. In the Bond Analysis dialog box, click OK to return to the Bond dialog box. In the Bond dialog box, click OK to return to the Investment Analysis dialog box.


