Getting Started with Time Series Forecasting
Select the first icon in the vertical toolbar to the right of the table to return the display to the predicted and actual values plots (Figure 46.39).
Now return to the Develop Models window, but do not close the Model Viewer window. You can use the Next Viewer icon in the toolbar or your system’s window manager controls to switch windows. You can resize the windows to make them both visible.
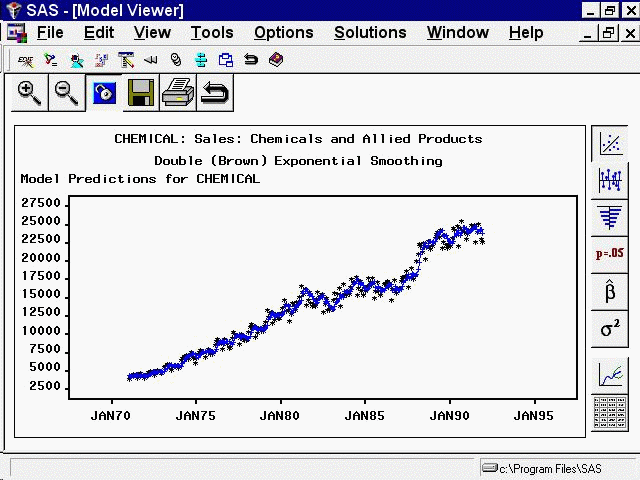
Select the Double Exponential Smoothing model so that this line of the model list is highlighted. The Model Viewer window
is now updated to display a plot of the predicted values for the Double Exponential Smoothing model, as shown in Figure 46.46. The Model Viewer is automatically updated to display the currently selected model, unless you specify Unlink (the third icon in the window’s horizontal toolbar).
