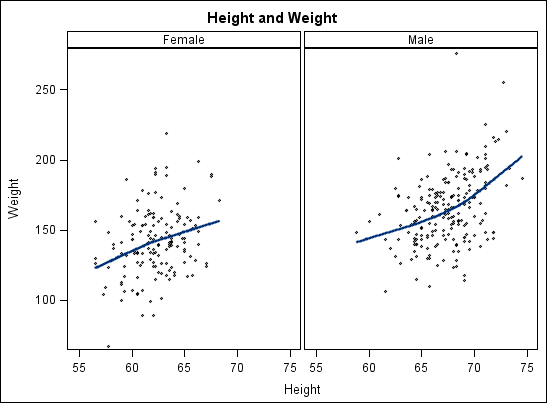
A classification panel
can be defined using a lattice or a panel layout. Both layouts are
data-driven layouts that create a grid of cells based on one or more
panel (or classification) variables. The number and layout of the
cells is determined by the unique values of the panel variables.
Here is an example of
a simple classification panel:
Here are the characteristics
of classification panels:
-
You can define up to two panel
variables in the designer.
-
All panel and plot variables must
come from a single data set.
-
Plots can be added to a classification
panel the same way they are added to cells in other graphs. When you
add a plot to any cell of the panel, the plot is displayed in every
cell. The plot is displayed with the appropriate subset of the data
for the combination of the panel variables.
Note: Ellipse plots cannot be added
to classification panels.
-
When you change the plot data or
properties in one cell, the change is applied to all the cells of
the graph.
