Working with Axis Properties
Axis properties reside
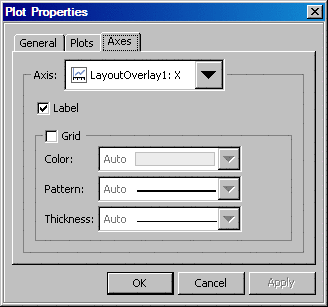
in the Plot Properties dialog box. To open
the Axes tab of the Plot Properties dialog box, right-click an axis and select Axis Properties.
On the Axes tab, you can modify the properties of labels for all the axes in
a plot. You can select the axis that you want to modify from the Axis list box.
Select or clear the Grid check box to toggle the grid lines on and off for
the selected axis. If the Grid check box
is selected, then you can modify the color, the pattern (such as dotted
or dashed), and the thickness of the grid lines.
For changes that can
be made to axis labels, see Working with Axis Labels.
