When you specify different
graph, plot, or annotation properties, you might have the option to
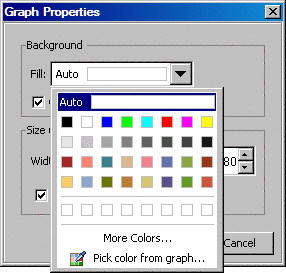
select a color from a color list box. The color list box contains
predefined colors to choose from and the option to define your own
color. You can also pick an existing color from the graph.
The color list box contains
the following items:
Restore the default
color. This field is useful when you have changed a color and want
to restore the original color.
Select a predefined
color from the palette.
Row of recently used custom colors
Select a custom color.
This row is populated with colors that you choose by using either
the More Colors or the Pick color
from graph option.
Locate a custom color.
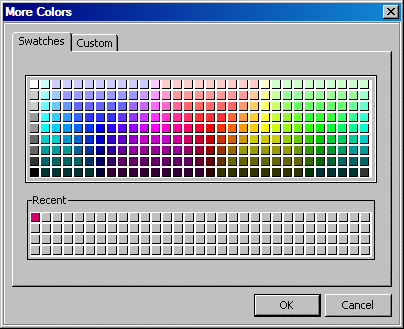
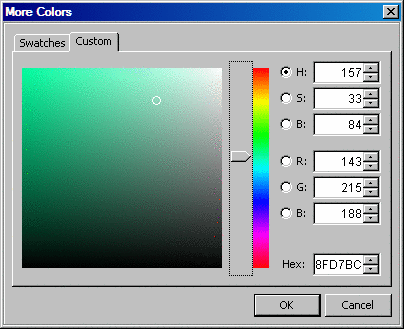
This option opens the More Colors dialog
box, which contains two tabs:
|
In the Swatches tab, select a color from the palette.
|
|
In the Custom tab, choose a color by dragging the slider and then picking a point
in the color preview box. Alternatively, you can specify the HSB,
RBG, or hexadecimal color value.
|
After you click this
link, the color list box closes. You can then select any of the colors
currently displayed in the graph by clicking the desired color.