ODS Style Templates

It is often useful to create graphs with specific visual characteristics that do not have to be hard coded into the GTL for every graph that you create. For example, you might want to modify settings for the following graph features:
  • font or font sizes
  • line or marker properties
  • colors
  • display features for box plots, histograms, contours, and other chart types
  • a combination of features that are related to a publication or corporate presentation scheme.
Because the default properties of nearly all GTL appearance-related options are obtained from the current style (see Managing Graph Appearance: General Principles), modifying an existing style is often the best way to enforce a certain look-and-feel across many graphs.
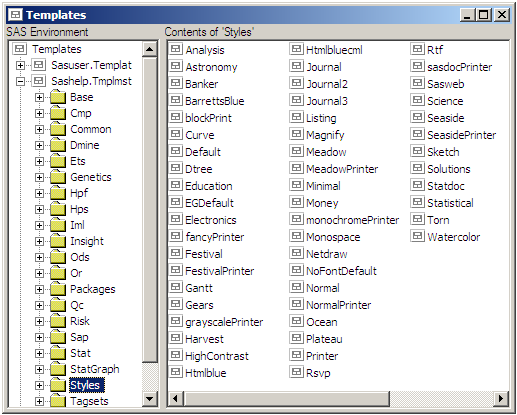
Similar to graphics templates, ODS style templates are stored in SAS item stores. All styles supplied by SAS are located in the STYLES directory of the SASHELP.TMPLMST item store. Templates can be viewed from the Templates window (ODSTEMPLATE command). The template source can be viewed by opening any template.
Templates Window
Although an ODS style can be constructed from scratch, it is much simpler to identify a style that is fairly close to what you want and make limited changes to it. The following styles are recommended starting points.
Style
Example
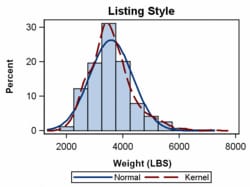
LISTING
  • white background
  • white wall
  • sans-serif fonts
  • color used for lines, markers, and filled areas
  • other colors the same as DEFAULT style
Graph with LISTING Style
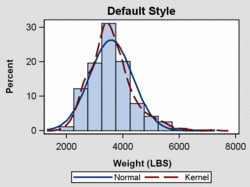
DEFAULT
  • gray background
  • white wall
  • sans-serif fonts
Graph with DEFAULT Style
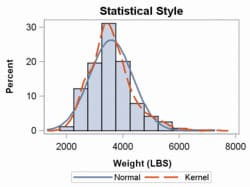
STATISTICAL
  • white background
  • white wall
  • sans-serif fonts
  • contrasting color scheme of blues, reds, greens for markers, lines, and filled areas
Graph with STATISTICAL Style
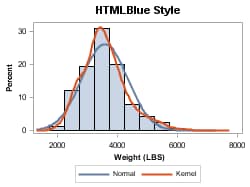
HTMLBLUE
  • white background
  • white wall
  • sans-serif fonts
  • table colors match the graph colors
  • group distinctions based on color rather than marker or line styles
  • a lighter color scheme for HTML content
Graph with HTMLBLUE Style
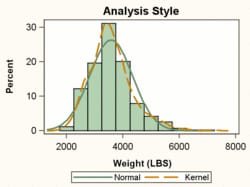
ANALYSIS
  • light tan background
  • white wall
  • sans-serif fonts
  • muted color scheme of tans, greens, yellows, oranges and browns for lines, markers, and filled areas
Graph with ANALYSIS Style
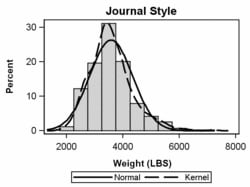
JOURNAL and JOURNAL3
  • white background
  • white wall
  • sans-serif fonts
  • gray-scale color scheme for markers, lines, and filled areas
  • gray-scale pattern and color scheme for bar fill patterns (JOURNAL3 only)
Graph with JOURNAL Style
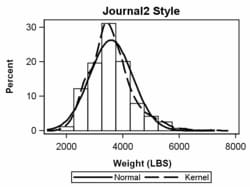
JOURNAL2
  • white background
  • white wall
  • sans-serif fonts
  • black-only scheme for markers, lines, and bar fill patterns
  • no solid filled areas—a minimal ink style
Graph with JOURNAL2 Style