Example Programs and Summary
Overview of Example Programs and Summary
All of the example programs access
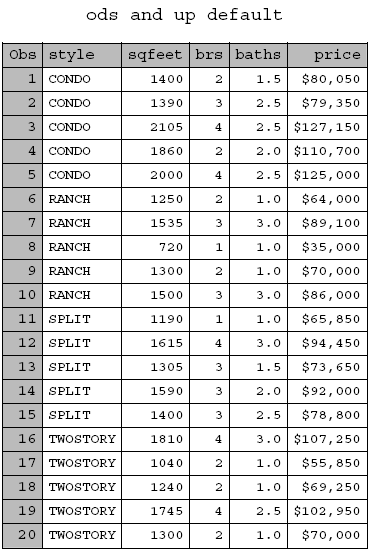
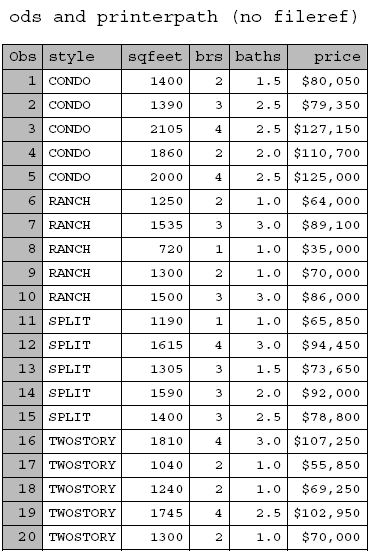
the SASLIB.HOUSES data set, which is shown in The SASLIB.HOUSES Data Set. The first four example programs execute
the same PROC PRINT using different combinations of output formats
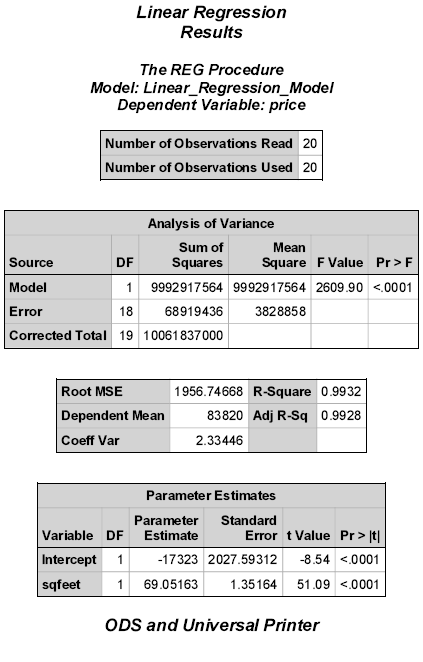
and printing destinations. Example 5 and Example 6 use SAS/GRAPH code
to execute PROC REG followed by PROC GPLOT, again with different output
formats and printing destinations. For a summary of the results, see Summary of Printing Examples.
The example programs
were developed on the z/OS platform, with a printer device of PostScript
output written to a file.
To generate output to
other printer definitions, use the printers defined at your site,
or include your own printer definitions. For more information about
printer definitions, see Setting Up a Universal Printer with PROC PRTDEF.
Example 2: ODS and the PRINTERPATH System Option
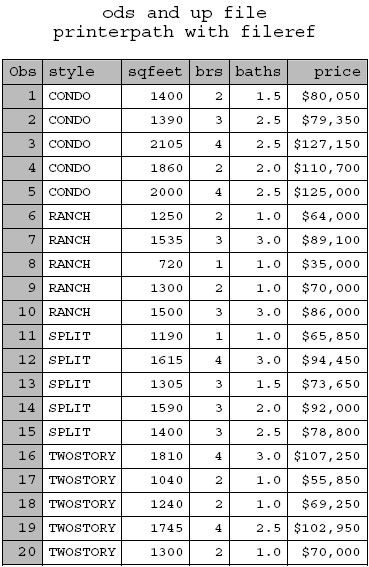
Example 3: ODS and the PRINTERPATH System Option (with FILEREF)
options linesize=80 nodate;
libname saslib '.saslib.data';

filename outlist '.sasprt.out';
options printerpath = ('Postscript' outlist);
ods listing close;
ods printer;

title1 'ods and up file';
title2 'printerpath with fileref';

proc print data=saslib.houses;
   format price dollar10.0;
run;

ods printer close;Example 4: PRINTERPATH and FILENAME UPRINTER Statement
The following example
code uses a line printer to format output to a PostScript printer.
Because no font is specified, the font that is used is the default
12-point Courier font.
options linesize=80 nodate;
libname saslib '.saslib.data';

title1 'proc printto';
title2 'filename upr and printerpath';

options printerpath = Postscript;
filename upr uprinter;

proc printto print=upr; run;

proc print data=saslib.houses;
   format price dollar10.0;
run;
1                                  proc printto
     1
                           filename upr and printerpath

                 style       sqfeet    brs    baths         price

                 CONDO        1400      2      1.5        $80,050
                 CONDO        1390      3      2.5        $79,350
                 CONDO        2105      4      2.5       $127,150
                 CONDO        1860      2      2.0       $109,250
                 CONDO        2000      4      2.5       $125,000
                 RANCH        1250      2      1.0        $64,000
                 RANCH        1535      3      3.0        $89,100
                 RANCH         720      1      1.0        $35,000
                 RANCH        1300      2      1.0        $70,000
                 RANCH        1500      3      3.0        $86,000
                 SPLIT        1190      1      1.0        $65,850
                 SPLIT        1615      4      3.0        $94,450
                 SPLIT        1305      3      1.5        $73,650
                 SPLIT        1590      3      2.0        $92,000
                 SPLIT        1400      3      2.5        $78,800
                 TWOSTORY     1810      4      3.0       $107,250
                 TWOSTORY     1040      2      1.0        $55,850
                 TWOSTORY     1240      2      1.0        $69,250
                 TWOSTORY     1745      4      2.5       $102,950
                 TWOSTORY     1200      4      1.0       $70,000
Example 5: SAS/GRAPH: ODS and PRINTERPATH System Option
options nodate;
goptions reset=all;
libname saslib '.saslib.data';

filename out '.graphip.ps';
options printerpath=(Postscript out);
ods listing close;
goptions device=sasprtc cback=white gsfmode=append;
ods printer style=default;

footnote "ODS and Universal Printer";
title1 "Linear Regression";
title2 "Results";

proc reg data=saslib.houses;
  /* Regression model */
     Linear_Regression_Model: MODEL price = sqfeet / ;

  /* output dataset to use as input for plots */
   output out = WORK._PLOTOUT
          predicted = _predicted1
          residual  = _residual1
          student   = _student1
          rstudent  = _rstudent1;
     run;
quit;

goptions hsize=5in vsize=5in;
goptions border;

title1 "Regression Analysis";
title2 "Plots";
axis1 major=(number=5) width=1;
axis3 major=(number=5) offset=(5 pct) width=1;

proc gplot data=WORK._PLOTOUT;
   where price is not missing and
     sqfeet is not missing;

   /* ********* PREDICTED plots ********* */

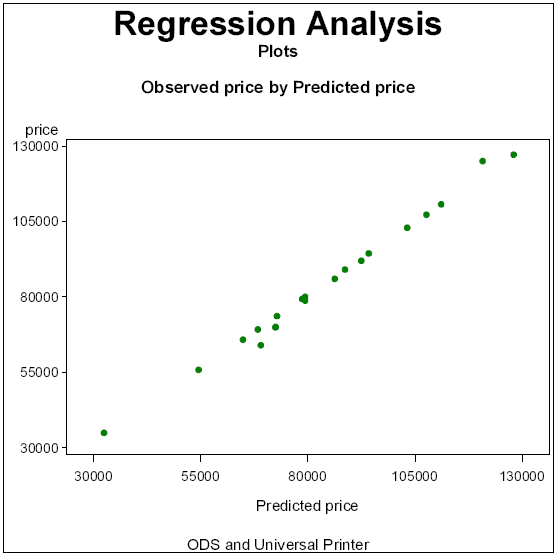
   title4 "Observed price by Predicted price";
   symbol1 C=GREEN V=DOT height=2PCT interpol=NONE L=1 W=1;
   label _predicted1 = "Predicted price";
   where price is not missing and _predicted1 is not missing;
   plot price * _predicted1 /
      vaxis=AXIS1 vminor=0 haxis=AXIS3 hminor=0
      description = "Observed price by Predicted price";
   run;

    /* ********* RESIDUAL plots ********* */

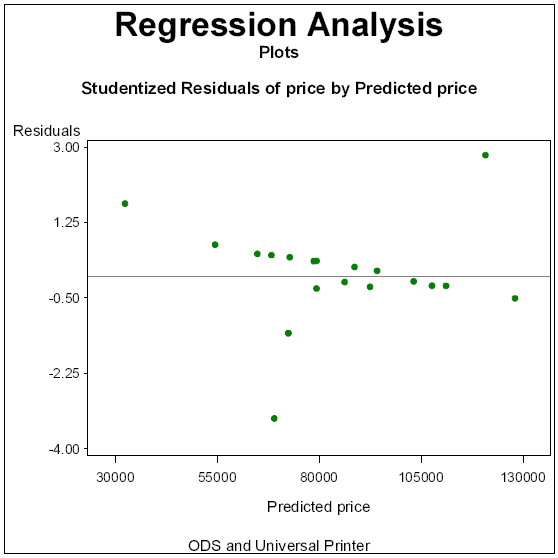
   title9 "Studentized Residuals of price by Predicted price";
   symbol1 C=GREEN V=DOT height=2PCT interpol=NONE L=1 W=1;
   label _rstudent1 = "Residuals";
   label _predicted1 = "Predicted price";
   where _rstudent1 is not missing and _predicted1 is not missing;
   plot _rstudent1 * _predicted1 /
     vaxis=AXIS1 vminor=0 haxis=AXIS3 hminor=0 vref=0
     description = "Studentized Residuals of price by Predicted price";
   run;
   symbol;
quit;

proc delete data=WORK._PLOTOUT; run;
title; footnote; run;

ods printer close;Example 6: SAS/GRAPH: No ODS or PRINTERPATH System Option
options linesize=80 nodate;
goptions reset=all;
filename out '.graphip.ps';
goptions device=ps gsfname=out;
goptions cback=white gsfmode=append;
libname saslib '.saslib.data';

footnote "Regular SAS/GRAPH PS Output; no ODS, no Universal Printer";
title1 "Linear Regression";
title2 "Results";

proc reg data=saslib.houses;
  /* Regression model */
     Linear_Regression_Model: MODEL price = sqfeet / ;

  /* output dataset to use as input for plots */
   output out = WORK._PLOTOUT
          predicted = _predicted1
          residual  = _residual1
          student   = _student1
          rstudent  = _rstudent1;
     run;
quit;

goptions hsize=5in vsize=5in;
goptions border;

title1 "Regression Analysis";
title2 "Plots";
axis1 major=(number=5) width=1;
axis3 major=(number=5) offset=(5 pct) width=1;

proc gplot data=WORK._PLOTOUT;
   where price is not missing and
     sqfeet is not missing;

   /* ********* PREDICTED plots ********* */

   title4 "Observed price by Predicted price";
   symbol1 C=GREEN V=DOT height=2PCT interpol=NONE L=1 W=1;
   label _predicted1 = "Predicted price";
   where price is not missing and _predicted1 is not missing;
   plot price * _predicted1 /
      vaxis=AXIS1 vminor=0 haxis=AXIS3 hminor=0
      description = "Observed price by Predicted price";
   run;

    /* ********* RESIDUAL plots ********* */

   title9 "Studentized Residuals of price by Predicted price";
   symbol1 C=GREEN V=DOT height=2PCT interpol=NONE L=1 W=1;
   label _rstudent1 = "Residuals";
   label _predicted1 = "Predicted price";
   where _rstudent1 is not missing and _predicted1 is not missing;
   plot _rstudent1 * _predicted1 /
     vaxis=AXIS1 vminor=0 haxis=AXIS3 hminor=0 vref=0
     description = "Studentized Residuals of price by Predicted price";
   run;
   symbol;
quit;

proc delete data=WORK._PLOTOUT; run;
title; footnote; run;1 Linear Regression
1
Results
The REG Procedure
Model: Linear_Regression_Model
Dependent Variable: price
Analysis of Variance
Sum of Mean
Source DF Squares Square F Value Pr > F
Model 1 12798244470 12798244470 3791.82 <.0001
Error 26 87755798 3375223
Corrected Total 27 12886000268
Root MSE 1837.17800 R-Square 0.9932
Dependent Mean 83716 Adj R-Sq 0.9929
Coeff Var 2.19453
Parameter Estimates
Parameter Standard
Variable DF Estimate Error t Value Pr > |t|
Intercept 1 -16246 1660.05685 -9.79 <.0001
sqfeet 1 68.52572 1.11283 61.58 <.0001
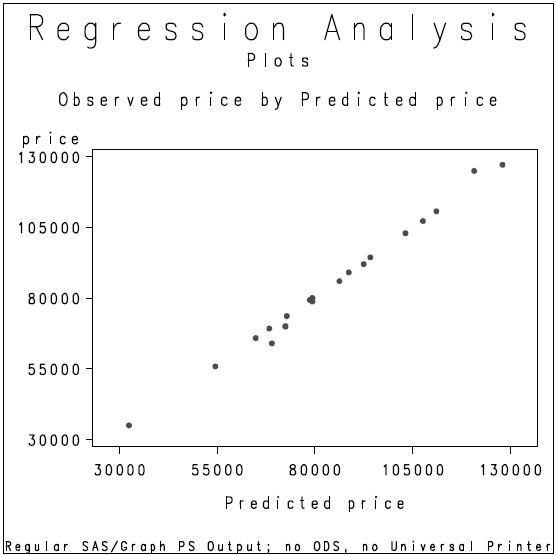
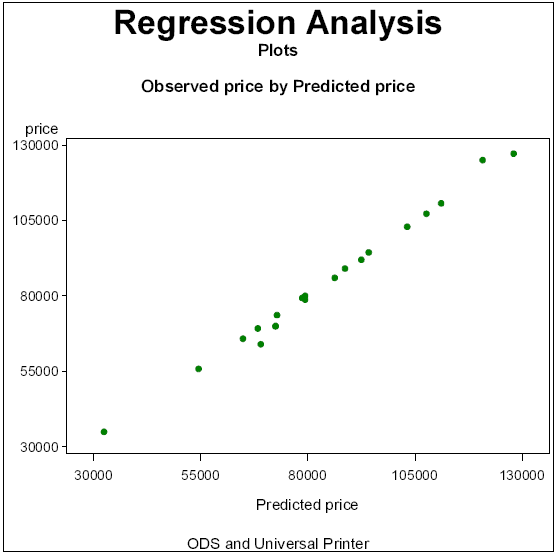
Regular SAS/GRAPH PS Output; no ODS, no Universal PrinterThe following output
shows the “Observed price by Predicted price” plot for
this example. The two graphs are written to
.GRAPHIP.PS.
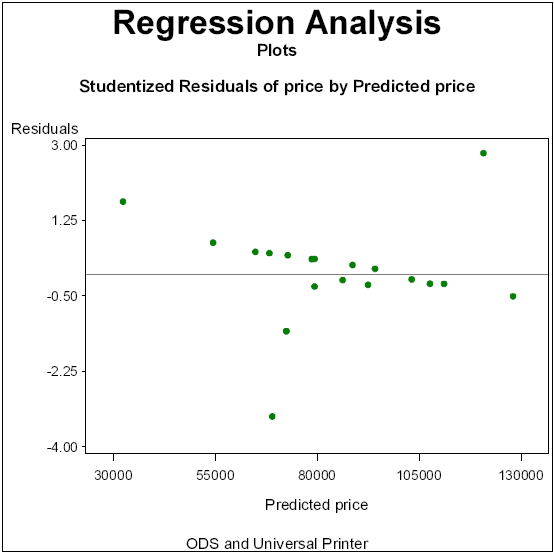
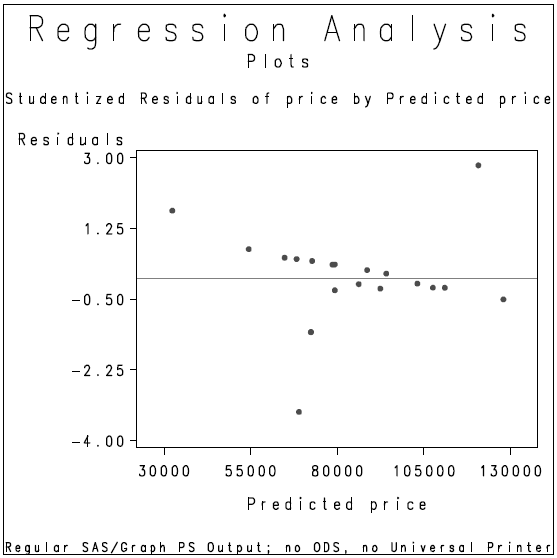
The following output
shows the “Studentized Residuals of price by Predicted price”
plot for this example:
