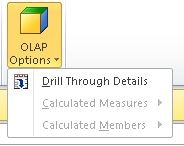
Implementing Drill-through to Detail Data in a SAS OLAP Cube
Many SAS OLAP applications
give users the ability to select a cell or a range of cells and then
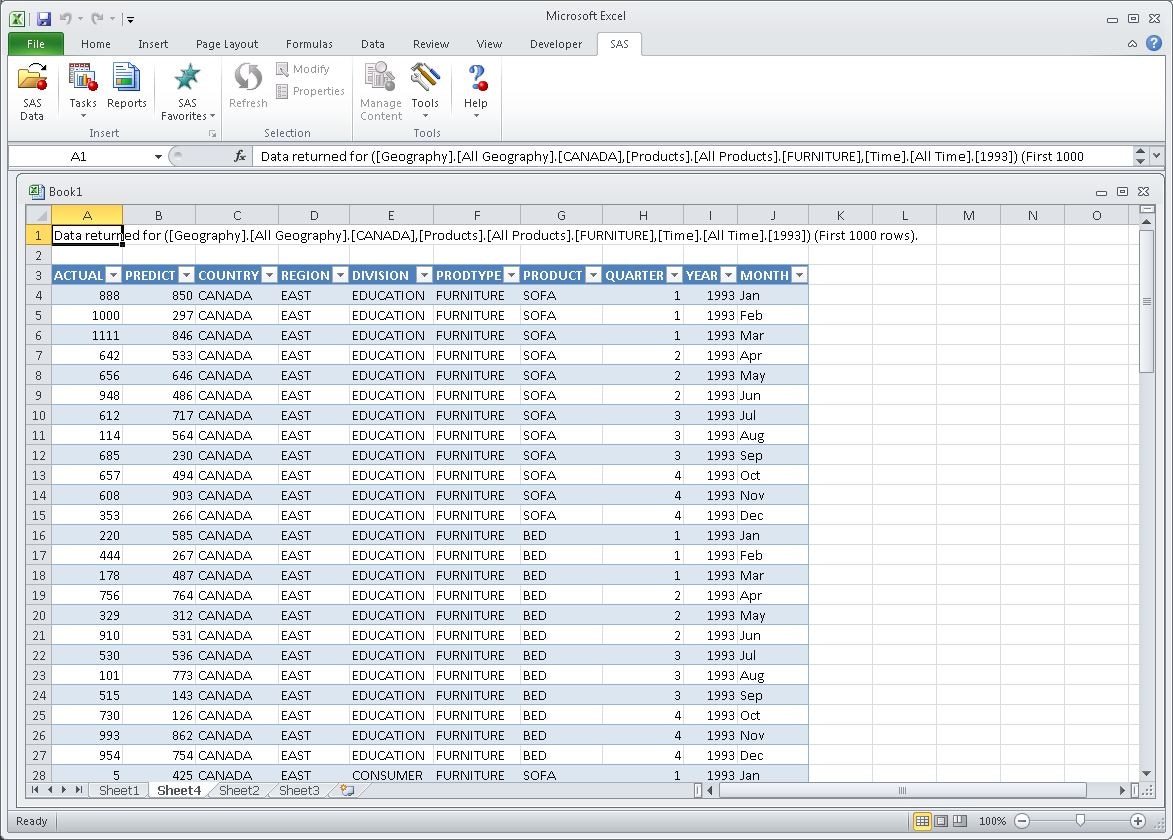
view the input data that the cell data was summarized from. SAS OLAP
enables you to assign a drill-through table to a cube. You can then
access the underlying cell data.
Note: When you select a data table
for drill-through, you might need to consider user access and security
restrictions for that table. For further information see Security for Drill-through Tables.
In this example, a
cube is assigned a drill-through table, and then the cube is accessed
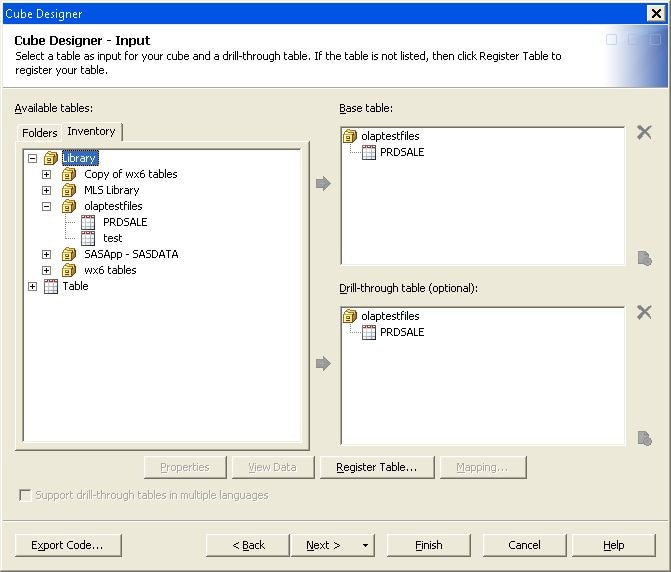
in Microsoft Excel 2007. In SAS OLAP Cube Studio, open a cube in the Cube Designer wizard. In the Cube Designer
– Input page, assign a drill-through table. This
is often the same table that is used as the input table for the cube.
Click Finish to save the drill-through table
assignment to the cube. See the following display.
In Microsoft Excel 2007,
select Data From Other
sources
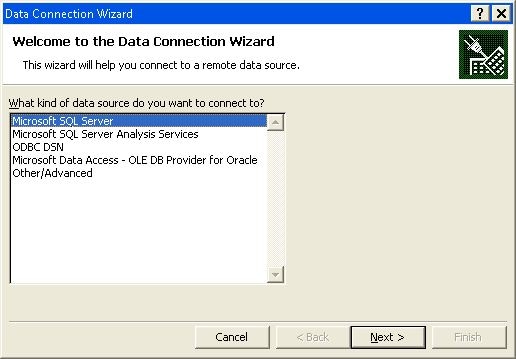
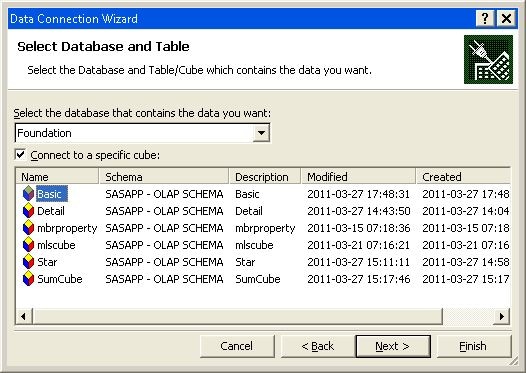
 From Data Connection Wizard. This opens the Data Connection Wizard. Select the
option Other/Advanced. Select Next.
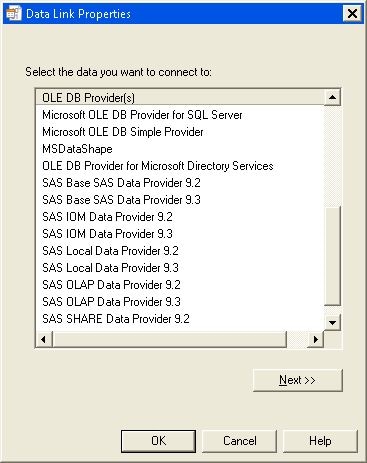
On the Data
Link Properties page, select the Provider tab. In the list of data provider options, select the appropriate
release of the SAS OLAP Data Provider. Click OK to return to the Data Link Properties dialog box.
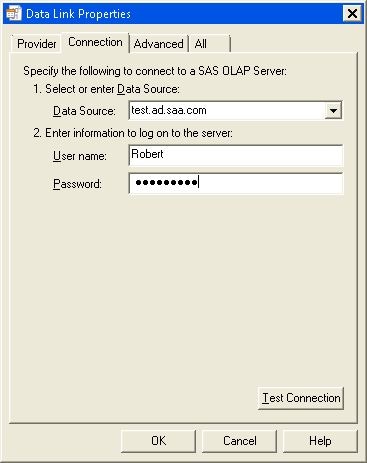
Click Test
Connection to test the connection to the SAS OLAP Server.
Click OK to respond to the Connection
Succeeded message and return to the Data
Link Properties dialog box. Click OK to return to the Data Connection Wizard.
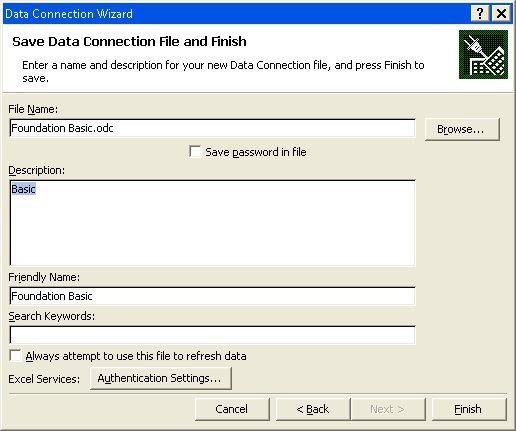
On the Save Data Connection
File and Finish page, enter data that will
help you and others access the cube and understand its purpose. You
can enter a Description, Friendly
Name, and Search Keywords for
the cube. Click Finish to complete the Data
Connection Wizard.
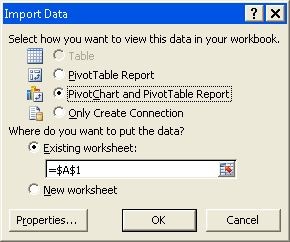
The Import
Data dialog box appears. Select to view the cube data
in a PivotTable Report or in a PivotChart and a PivotTable Report. Click OK.
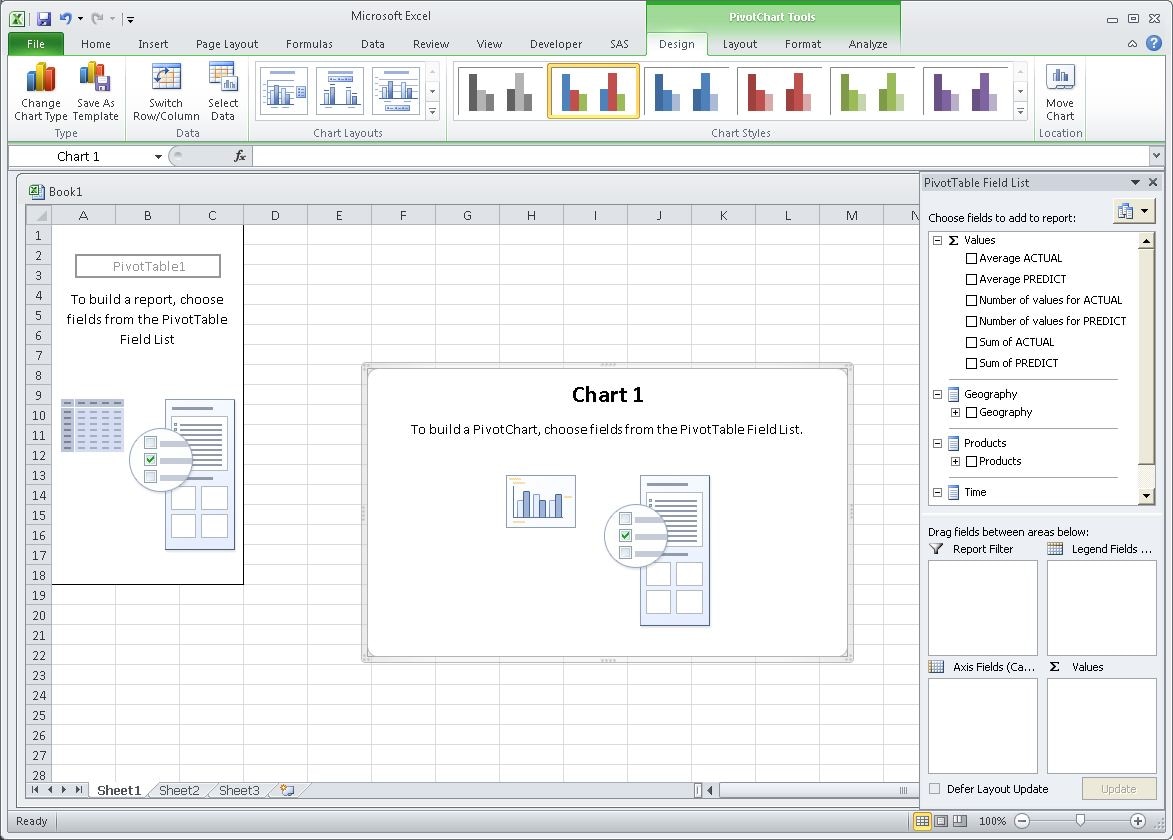
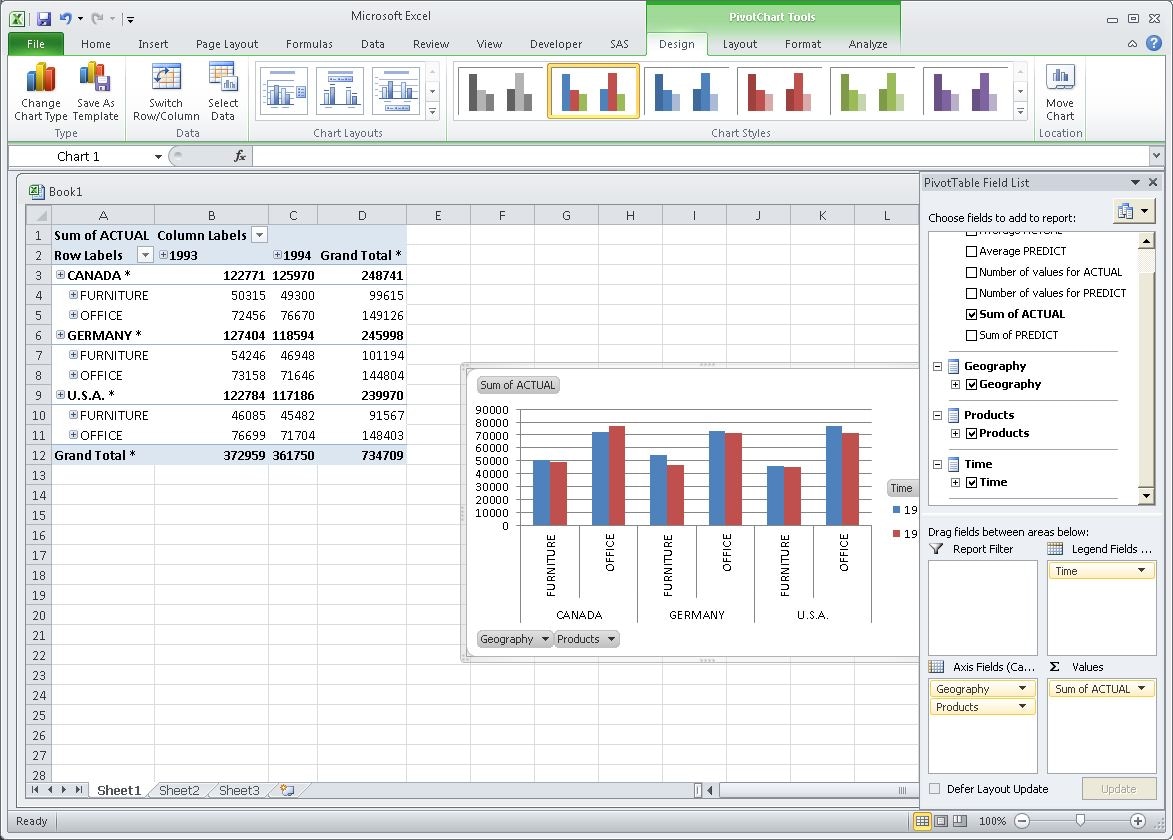
The pivot table opens,
along with the pivot chart, if it is selected. From here you can select
fields to add to your pivot table and pivot chart.
