Using the Output Delivery System
-
Overview

-
ExamplesCreating HTML Output with ODSSelecting ODS Tables for DisplayExcluding ODS Tables from DisplayCreating an Output Data Set from an ODS TableCreating an Output Data Set: Subsetting the DataRUN-Group ProcessingODS Output Data Sets and Using PROC TEMPLATE to Customize OutputHTML Output with Hyperlinks between TablesHTML Output with Graphics and HyperlinksCorrelation and Covariance Matrices
- References
In the LISTING destination, tables are displayed in monospace, and graphs are not integrated with tables. You can create LISTING
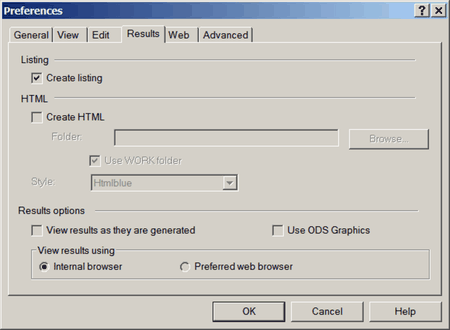
output by selecting ![]()
![]() from the menu at the top of the main SAS window. Then click the tab. Select , and clear . See Figure 20.2. Tabular results are viewed in the Output window. Graphical results are viewed by selecting graphs in the Results window.
from the menu at the top of the main SAS window. Then click the tab. Select , and clear . See Figure 20.2. Tabular results are viewed in the Output window. Graphical results are viewed by selecting graphs in the Results window.
You can enable or disable ODS Graphics by default by using the check box, and you can use the ODS GRAPHICS ON and ODS GRAPHICS OFF statements to enable and disable ODS Graphics in your SAS programs.