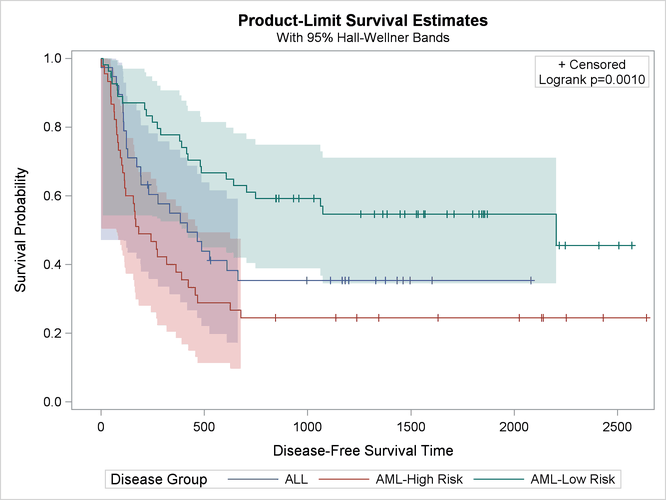
This example is taken from Example 56.2 of Chapter 56: The LIFETEST Procedure. It shows how to construct a product-limit survival estimate plot. Both the ODS GRAPHICS statement and procedure options are
used to request the plot. This examples uses the bone marrow transplant data set, which is available from the Sashelp library. The data set contains disease-free times for three risk categories.
The following statements use PROC LIFETEST to compute the product-limit estimate of the survivor function for each risk category:
ods graphics on;

proc lifetest data=sashelp.BMT plots=survival(cb=hw test);
   time T * Status(0);
   strata Group / test=logrank;
run;
The ODS GRAPHICS ON statement enables ODS Graphics, and the PLOTS=SURVIVAL option requests a plot of the estimated survival curves. The CB=HW suboption requests Hall-Wellner confidence bands, and the TEST suboption displays the p-value for the log-rank test in a plot inset.
Figure 21.4 displays the plot; note that tabular output is not shown. Patients in the AML-Low Risk group are disease-free longer than those in the ALL group, who in turn fare better than those in the AML-High Risk group.
