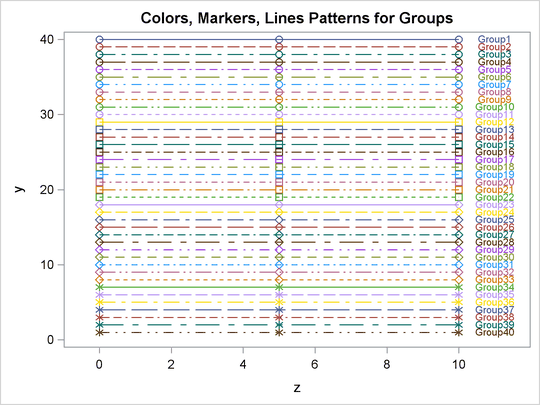
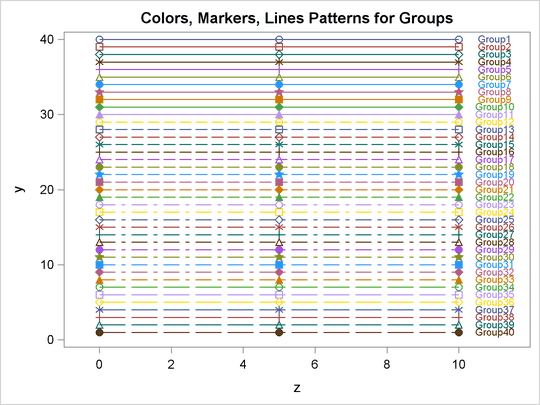
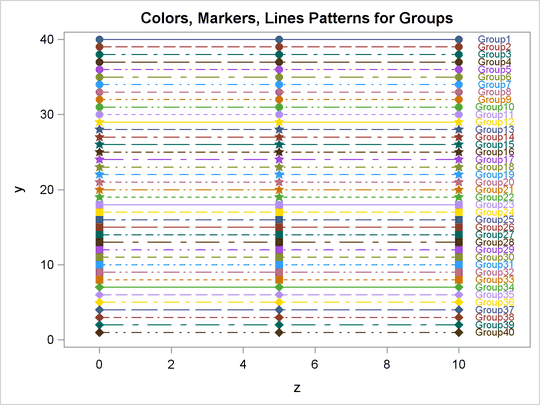
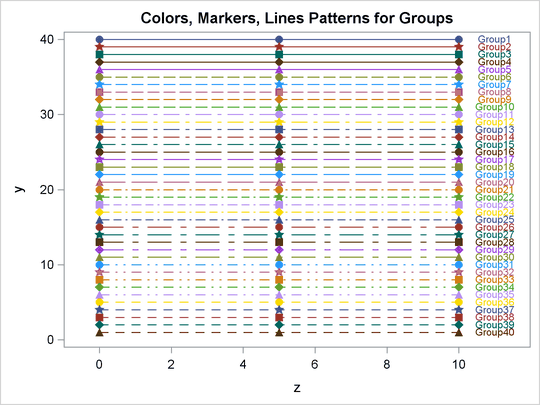
The HTMLBLUE style is an all-color style for the first 12 groups of observations. After each set of 12 groups, the line style and marker change for the next 12 groups. See Figure 21.40. The HTMLBLUECML style is a color style in which groups of observations are distinguished by simultaneous color, line style, and symbol changes. See Figure 21.41. For some graphs, you might want more differentiation than you get in an all-color style like HTMLBLUE but without the overkill differentiation of the HTMLBLUECML style and other styles. This section defines four new styles for this purpose:
HTMLBLUEL – line styles and colors vary together with fixed markers for each set of 11 groups
HTMLBLUEM – markers and colors vary together with fixed line styles for each set of 11 groups
HTMLBLUEFL – line styles and colors vary together with fixed filled markers for each set of 11 groups
HTMLBLUEFM – filled markers and colors vary together with fixed line styles for each set of 5 groups
The following statements show part of the style template for each of these styles:
define style Styles.HTMLBlueL;    parent = styles.htmlbluecml;
   style GraphFit2   from GraphFit2   /                         linestyle = 1;
   style GraphData1  from GraphData1  / markersymbol = "circle" linestyle = 1;
   style GraphData2  from GraphData2  / markersymbol = "circle" linestyle = 4;
   style GraphData3  from GraphData3  / markersymbol = "circle" linestyle = 8;
   style GraphData4  from GraphData4  / markersymbol = "circle" linestyle = 5;
   style GraphData5  from GraphData5  / markersymbol = "circle" linestyle = 14;
   style GraphData6  from GraphData6  / markersymbol = "circle" linestyle = 26;
   style GraphData7  from GraphData7  / markersymbol = "circle" linestyle = 15;
   style GraphData8  from GraphData8  / markersymbol = "circle" linestyle = 20;
   style GraphData9  from GraphData9  / markersymbol = "circle" linestyle = 41;
   style GraphData10 from GraphData10 / markersymbol = "circle" linestyle = 42;
   style GraphData11 from GraphData11 / markersymbol = "circle" linestyle = 2;
   style GraphData12 from GraphData12 / markersymbol = "square" linestyle = 1;
   style GraphData13 from GraphData1  / markersymbol = "square" linestyle = 4;
   style GraphData14 from GraphData2  / markersymbol = "square" linestyle = 8;
   style GraphData15 from GraphData3  / markersymbol = "square" linestyle = 5;
   . . .
end;
define style Styles.HTMLBlueM;    parent = styles.htmlbluecml;
   style GraphFit2   from GraphFit2   /                                 linestyle = 1;
   style GraphData1  from GraphData1  / markersymbol = "circle"         linestyle = 1;
   style GraphData2  from GraphData2  / markersymbol = "square"         linestyle = 1;
   style GraphData3  from GraphData3  / markersymbol = "diamond"        linestyle = 1;
   style GraphData4  from GraphData4  / markersymbol = "asterisk"       linestyle = 1;
   style GraphData5  from GraphData5  / markersymbol = "plus"           linestyle = 1;
   style GraphData6  from GraphData6  / markersymbol = "triangle"       linestyle = 1;
   style GraphData7  from GraphData7  / markersymbol = "circlefilled"   linestyle = 1;
   style GraphData8  from GraphData8  / markersymbol = "starfilled"     linestyle = 1;
   style GraphData9  from GraphData9  / markersymbol = "squarefilled"   linestyle = 1;
   style GraphData10 from GraphData10 / markersymbol = "diamondfilled"  linestyle = 1;
   style GraphData11 from GraphData11 / markersymbol = "trianglefilled" linestyle = 1;
   style GraphData12 from GraphData12 / markersymbol = "circle"         linestyle = 4;
   style GraphData13 from GraphData1  / markersymbol = "square"         linestyle = 4;
   style GraphData14 from GraphData2  / markersymbol = "diamond"        linestyle = 4;
   style GraphData15 from GraphData3  / markersymbol = "asterisk"       linestyle = 4;
   . . .
end;
define style Styles.HTMLBlueFL;    parent = styles.htmlbluecml;
   style GraphFit2   from GraphFit2   /                               linestyle = 1;
   style GraphData1  from GraphData1  / markersymbol = "circlefilled" linestyle = 1;
   style GraphData2  from GraphData2  / markersymbol = "circlefilled" linestyle = 4;
   style GraphData3  from GraphData3  / markersymbol = "circlefilled" linestyle = 8;
   style GraphData4  from GraphData4  / markersymbol = "circlefilled" linestyle = 5;
   style GraphData5  from GraphData5  / markersymbol = "circlefilled" linestyle = 14;
   style GraphData6  from GraphData6  / markersymbol = "circlefilled" linestyle = 26;
   style GraphData7  from GraphData7  / markersymbol = "circlefilled" linestyle = 15;
   style GraphData8  from GraphData8  / markersymbol = "circlefilled" linestyle = 20;
   style GraphData9  from GraphData9  / markersymbol = "circlefilled" linestyle = 41;
   style GraphData10 from GraphData10 / markersymbol = "circlefilled" linestyle = 42;
   style GraphData11 from GraphData11 / markersymbol = "circlefilled" linestyle = 2;
   style GraphData12 from GraphData12 / markersymbol = "starfilled"   linestyle = 1;
   style GraphData13 from GraphData1  / markersymbol = "starfilled"   linestyle = 4;
   style GraphData14 from GraphData2  / markersymbol = "starfilled"   linestyle = 8;
   style GraphData15 from GraphData3  / markersymbol = "starfilled"   linestyle = 5;
   . . .
end;
define style Styles.HTMLBlueFM;    parent = styles.htmlbluecml;
   style GraphFit2   from GraphFit2   /                                 linestyle = 1;
   style GraphData1  from GraphData1  / markersymbol = "circlefilled"   linestyle = 1;
   style GraphData2  from GraphData2  / markersymbol = "starfilled"     linestyle = 1;
   style GraphData3  from GraphData3  / markersymbol = "squarefilled"   linestyle = 1;
   style GraphData4  from GraphData4  / markersymbol = "diamondfilled"  linestyle = 1;
   style GraphData5  from GraphData5  / markersymbol = "trianglefilled" linestyle = 1;
   style GraphData6  from GraphData6  / markersymbol = "circlefilled"   linestyle = 4;
   style GraphData7  from GraphData7  / markersymbol = "starfilled"     linestyle = 4;
   style GraphData8  from GraphData8  / markersymbol = "squarefilled"   linestyle = 4;
   style GraphData9  from GraphData9  / markersymbol = "diamondfilled"  linestyle = 4;
   style GraphData10 from GraphData10 / markersymbol = "trianglefilled" linestyle = 4;
   style GraphData11 from GraphData11 / markersymbol = "circlefilled"   linestyle = 8;
   style GraphData12 from GraphData12 / markersymbol = "starfilled"     linestyle = 8;
   style GraphData13 from GraphData1  / markersymbol = "squarefilled"   linestyle = 8;
   style GraphData14 from GraphData2  / markersymbol = "diamondfilled"  linestyle = 8;
   style GraphData15 from GraphData3  / markersymbol = "trianglefilled" linestyle = 8;
   . . .
end;
New GraphDatan style elements are created that inherit colors from the GraphData1 through GraphData12 style elements. The line styles and markers are explicitly set in the new style templates. The style GraphFit2 from GraphFit2 / linestyle = 1 statement creates a solid second fit line. You can remove that statement if you prefer a dashed second fit line.
The following statements use SAS macros to generate these four new styles:
proc template;
   %let m = circle square diamond asterisk plus triangle circlefilled
            starfilled squarefilled diamondfilled trianglefilled;
   %let ls = 1 4 8 5 14 26 15 20 41 42 2;
   %macro makestyle;
      %let l = %eval(%sysfunc(mod(&k,12))+1);
      %let k = %eval(&k+1);
      style GraphData&k from GraphData&l /
            linestyle=%scan(&ls, &j) markersymbol="%scan(&m, &i)";
      %mend;
   define style styles.HTMLBlueL;
      parent=styles.htmlbluecml;
      style GraphFit2 from GraphFit2 / linestyle = 1;
      %macro htmlbluel;
         %let k = 0;
         %do i = 1 %to 11; %do j = 1 %to 11; %makestyle %end; %end;
         %mend;
      %htmlbluel
      end;
   define style styles.HTMLBlueM;
      parent=styles.htmlbluecml;
      style GraphFit2 from GraphFit2 / linestyle = 1;
      %macro htmlbluem;
         %let k = 0;
         %do j = 1 %to 11; %do i = 1 %to 11; %makestyle %end; %end;
         %mend;
      %htmlbluem
      end;
   %let m = circlefilled starfilled squarefilled diamondfilled trianglefilled;
   define style styles.HTMLBlueFL;
      parent=styles.htmlbluecml;
      style GraphFit2 from GraphFit2 / linestyle = 1;
      %macro htmlbluel;
         %let k = 0;
         %do i = 1 %to 5; %do j = 1 %to 11; %makestyle %end; %end;
         %mend;
      %htmlbluel
      end;
   define style styles.HTMLBlueFM;
      parent=styles.htmlbluecml;
      style GraphFit2 from GraphFit2 / linestyle = 1;
      %macro htmlbluem;
         %let k = 0;
         %do j = 1 %to 11; %do i = 1 %to 5; %makestyle %end; %end;
         %mend;
      %htmlbluem
   end;
run;
The %LET m statement provides the list of markers. The %LET ls statement provides the list of line styles. The MAKESTYLE macro makes the kth style element from the GraphDatan style element for n = mod(k - 1, 12) + 1. The remaining macros vary markers and line styles in the appropriate order over the elements in each list.
The following step that was used in the section Style Comparisons is used with the different styles to produce Figure 21.49 through Figure 21.52:
proc sgplot data=x2;
   title 'Colors, Markers, Lines Patterns for Groups';
   series  y=y x=x / group=group markers;
   scatter y=y x=z / group=group markerchar=l;
run;


