Customizing the Kaplan-Meier Survival Plot
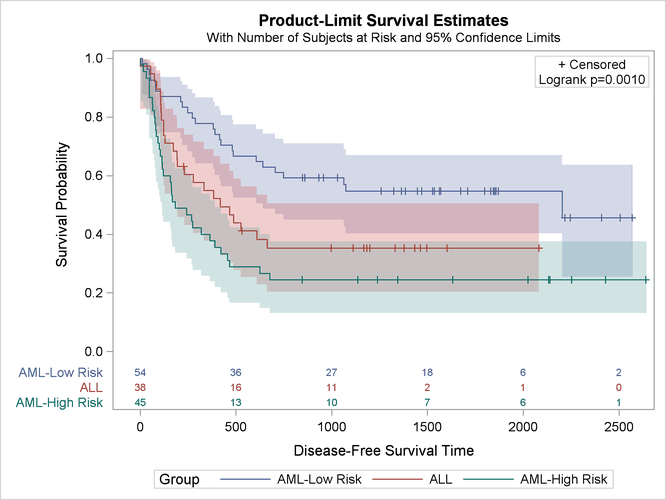
You can change the order of the legend entries by first changing each original group value to a new value in the desired order and then running the analysis with a FORMAT statement to provide the original values. In this example, the order is changed to AML–Low Risk (the top function), followed by ALL (the middle function), followed by AML–High Risk. With this ordering, there is a clearer correspondence between the functions, the at-risk table, and the legend. The following steps illustrate this reordering:
proc format;
   invalue bmtnum   'AML-Low Risk' = 1  'ALL' = 2  'AML-High Risk' = 3;
   value   bmtfmt   1 = 'AML-Low Risk'  2 = 'ALL'  3 = 'AML-High Risk';
run;

data BMT(drop=g);
   set sashelp.BMT(rename=(group=g));
   Group = input(g, bmtnum.);
run;

proc lifetest data=BMT plots=survival(cl test atrisk(maxlen=13));
   time T * Status(0);
   strata Group / order=internal;
   format group bmtfmt.;
run;
The PROC FORMAT step has two statements. The INVALUE statement creates an informat that maps the values of the original Group variable into integers that have the correct order. The VALUE statement creates a format that maps the integers back to the
original values. The informat is used with the INPUT function in the DATA step to create a new integer Group variable. The FORMAT statement assigns the BMTFMT format to the Group variable so that the actual risk groups are displayed in the analysis. You specify the ORDER=INTERNAL option in the STRATA
statement to sort the Group values based on internal order (the order specified by the integers, which are the internal unformatted values). This example
also illustrates the CL option, which displays pointwise confidence limits for the survival curve (instead of the Hall-Wellner
confidence bands). The results are displayed in Figure 23.13.
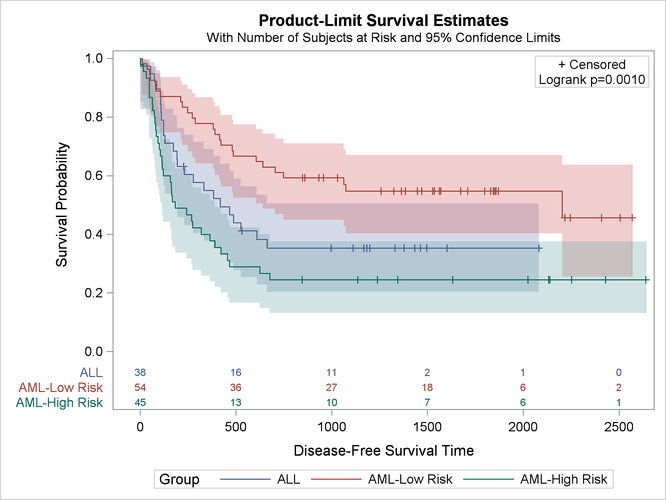
You can submit the following steps to display ALL first, followed by AML–Low Risk and then AML–High Risk:
proc format;
   invalue bmtnum 'ALL' = 1  'AML-Low Risk' = 2  'AML-High Risk' = 3;
   value   bmtfmt 1 = 'ALL'  2 = 'AML-Low Risk'  3 = 'AML-High Risk';
run;

data BMT(drop=g);
   set sashelp.BMT(rename=(group=g));
   Group = input(g, bmtnum.);
run;

proc lifetest data=BMT plots=survival(cl test atrisk(maxlen=13));
   time T * Status(0);
   strata Group / order=internal;
   format group bmtfmt.;
run;
The results are displayed in Figure 23.14.

