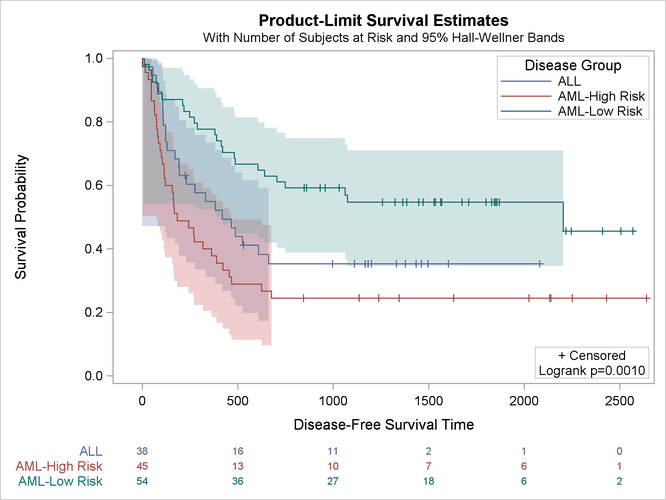
Customizing the Kaplan-Meier Survival Plot
This example shows you how to move the legend inside the plot (to the top right) and move the homogeneity test and censored value legend to the bottom right of the plot:
%ProvideSurvivalMacros

/*-- Original Macro Variable Definitions ----------------------------------
%let InsetOpts  = autoalign=(TOPRIGHT BOTTOMLEFT TOP BOTTOM)
                  border=true BackgroundColor=GraphWalls:Color Opaque=true;
%let LegendOpts = title=GROUPNAME location=outside;
-------------------------------------------------------------------------*/

%let InsetOpts  = autoalign=(BottomRight)
                  border=true BackgroundColor=GraphWalls:Color Opaque=true;
%let LegendOpts = title=GROUPNAME location=inside across=1 autoalign=(TopRight);

%CompileSurvivalTemplates

proc lifetest data=sashelp.BMT
              plots=survival(cb=hw test atrisk(outside maxlen=13));
   time T * Status(0);
   strata Group;
run;
This example shows you how to replace the AUTOALIGN=(TOPRIGHT BOTTOMLEFT TOP BOTTOM) option in the macro variable InsetOpts with AUTOALIGN=(BOTTOMRIGHT) and add the AUTOALIGN=(TOPRIGHT) option to the LegendOpts macro variable. You can also add the option ACROSS=1 to the LegendOpts macro variable to stack all legend entries vertically (with just one element in each row).
The results are displayed in Figure 23.24.
