Statistical Graphics Using ODS
Although ODS Graphics is designed to automate the creation of high-quality statistical graphics, on occasion you might need to modify your graphs. There are two ways you can make modifications, depending on whether the changes you want to make are data-dependent and immediate (for a specific graph you are preparing for a paper or presentation), or whether they are persistent (applied to a graph each time you run the procedure). You can make immediate, ad hoc changes by using the ODS Graphics Editor, which provides a point-and-click interface. You can make persistent changes by modifying the ODS graph template for a particular plot. For an introduction to graph template modification, see Chapter 22: ODS Graphics Template Modification. A graph template is a program, written in the Graph Template Language (GTL), that specifies the layout and details of a graph.
Note: The SAS system provides a template for each graph it creates, so you do not need to know anything about templates to create statistical graphics.
You can use the ODS Graphics Editor to customize titles and labels, annotate data points, add text, and change the properties of graph elements. After you have modified your graph, you can save it as a PNG image file or as an SGE file, which preserves the editing context. You can open SGE files with the ODS Graphics Editor and resume editing.
You can invoke the ODS Graphics Editor in the SAS windowing environment, provided that you have enabled ODS Graphics to create editable graphs. The steps for doing this are described in the section ODS Graphics Editor. Also see SAS 9.4 ODS Graphics Editor: User's Guide.
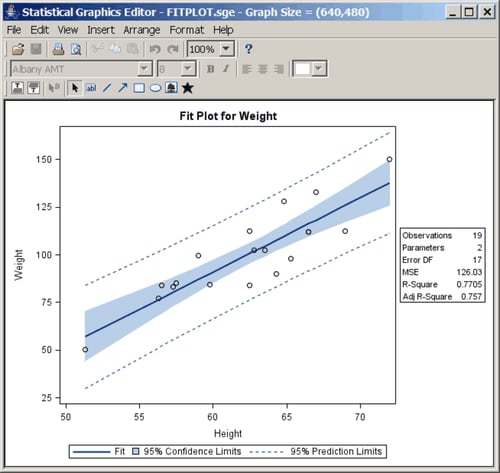
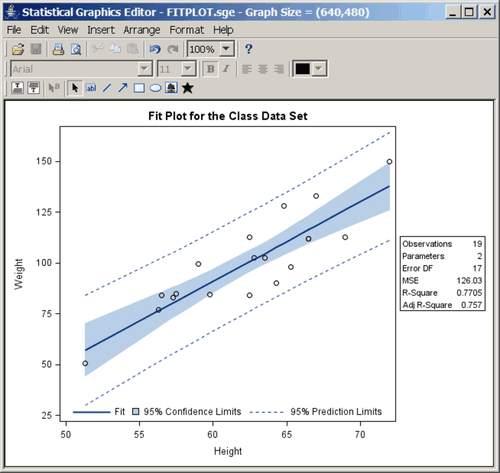
Figure 21.14 shows the ODS Graphics Editor window for a fit plot created by PROC REG. Figure 21.15 shows modifications made with tools in the ODS Graphics Editor. The title has been changed, and the legend has been repositioned.

