Analyses
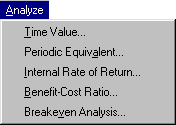
Figure 58.1 shows the Analyze menu.
The Analyze menu offers the following options for use on applicable investments.
Time Value opens the Time Value Analysis dialog box. Time value analysis involves moving money through time across a defined minimum attractive rate of return (MARR) so that you can compare value at a consistent date. The MARR can be constant or variable over time.
Periodic Equivalent opens the Uniform Periodic Equivalent dialog box. Uniform periodic equivalent analysis determines the payment needed to convert a cashflow to uniform amounts over time, given a periodicity, a number of periods, and a MARR. This option helps when making comparisons where one alternative is uniform (such as renting) and another is not (such as buying).
Internal Rate of Return opens the Internal Rate of Return dialog box. The internal rate of return of a cashflow is the interest rate that makes the time value equal to 0. This calculation assumes uniform periodicity of the cashflow. It is particularly applicable where the choice of MARR would be difficult.
Benefit-Cost Ratio opens the Benefit-Cost Ratio Analysis dialog box. The benefit-cost ratio divides the time value of the benefits by the time value of the costs. For example, governments often use this analysis when deciding whether to commit to a public works project.
Breakeven Analysis opens the Breakeven Analysis dialog box. Breakeven analysis computes time values at various MARRs to compare, which can be advantageous when it is difficult to determine a MARR. This analysis can help you determine how the cashflow’s profitability varies with your choice of MARR. A graph displaying the relationships between time value and MARR is also available.
