PROC CAPABILITY and General Statements
Example 5.2 Enhancing Reference Lines
See CAPSPEC1 in the SAS/QC Sample LibraryA telecommunications company manufactures amplifiers to be used in telephones. Each amplifier is designed to boost the input signal by 5 decibels (dB). Since it is difficult to make every amplifier’s boosting power exactly 5 decibels, the company decides that amplifiers that boost the input signal between 4 and 6 decibels are acceptable. Therefore, the target value is 5 decibels, and the lower and upper specification limits are 4 and 6 decibels, respectively. The following data set contains the boosting powers of a sample of 75 amplifiers:
data Amps;
   label Decibels = 'Amplification in Decibels (dB)';
   input Decibels @@;
   datalines;
4.54 4.87 4.66 4.90 4.68 5.22 4.43 5.14 3.07 4.22
5.09 3.41 5.75 5.16 3.96 5.37 5.70 4.11 4.83 4.51
4.57 4.16 5.73 3.64 5.48 4.95 4.57 4.46 4.75 5.38
5.19 4.35 4.98 4.87 3.53 4.46 4.57 4.69 5.27 4.67
5.03 4.50 5.35 4.55 4.05 6.63 5.32 5.24 5.73 5.08
5.07 5.42 5.05 5.70 4.79 4.34 5.06 4.64 4.82 3.24
4.79 4.46 3.84 5.05 5.46 4.64 6.13 4.31 4.81 4.98
4.95 5.57 4.11 4.15 5.95
;
The SPEC statement provides several options to control the appearance of reference lines for the specification limits and
the target value. The following statements use the data set Amps to create a histogram that demonstrates some of these options:
ods graphics off;
legend2 FRAME CFRAME=ligr CBORDER=black POSITION=center;
title 'Boosting Power of Telephone Amplifiers';
proc capability data=Amps;
   spec  target = 5      lsl = 4         usl = 6
        ltarget = 2     llsl = 3        lusl = 4
        wtarget = 2     wlsl = 2        wusl = 2
        cleft           cright;
   histogram Decibels / cbarline = black;
run;
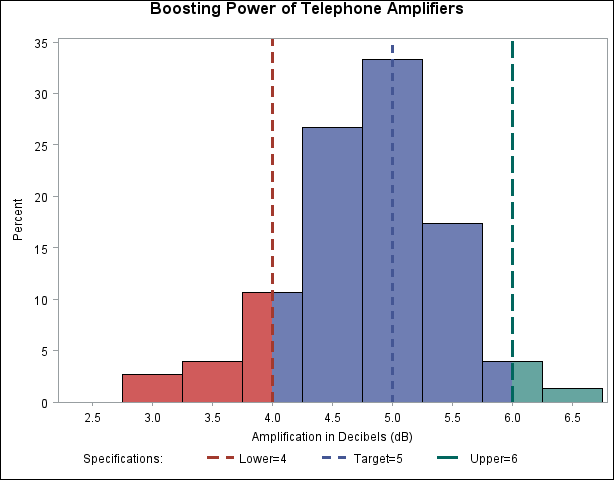
The resulting histogram is shown in Output 5.2.1. The LTARGET=, LLSL=, and LUSL= options control the line type of the reference lines for the target, lower specification limit, and upper specification limit, respectively. Likewise, the WTARGET=, WLSL=, and WUSL= options control the line widths. The CLEFT= option controls the color used to fill the area to the left of the lower specification limit. Similarly, the CRIGHT= option controls the color used to fill the area to the right of the upper specification limit.
Output 5.2.1: Controlling the Appearance of Specification Limits

