Getting Started: INSET Statement
This section introduces the INSET statement with a basic example showing how it is used. See the section INSET and INSET2 Statements: SHEWHART Procedure in Chapter 17: The SHEWHART Procedure, for a complete description of the INSET statement.
This example is based on the same scenario as the first example in the “Getting Started” subsection of XCHART Statement: CUSUM Procedure. A machine fills cans with oil additive and a two-sided cusum chart is used to detect shifts from the target mean of 8.100
ounces. The following statements create the data set Oil and request a two-sided cusum chart with an inset:
data Oil;
   label Hour = 'Hour';
   input Hour @;
   do i=1 to 4;
      input Weight @;
      output;
   end;
   drop i;
   datalines;
 1  8.024  8.135  8.151  8.065
 2  7.971  8.165  8.077  8.157
 3  8.125  8.031  8.198  8.050
 4  8.123  8.107  8.154  8.095
 5  8.068  8.093  8.116  8.128
 6  8.177  8.011  8.102  8.030
 7  8.129  8.060  8.125  8.144
 8  8.072  8.010  8.097  8.153
 9  8.066  8.067  8.055  8.059
10  8.089  8.064  8.170  8.086
11  8.058  8.098  8.114  8.156
12  8.147  8.116  8.116  8.018
;
title 'Cusum Chart for Average Weights of Cans';
ods graphics on;
proc cusum data=Oil;
   xchart Weight*Hour /
      mu0      = 8.100           /* Target mean for process  */
      sigma0   = 0.050           /* Known standard deviation */
      delta    = 1               /* Shift to be detected     */
      alpha    = 0.10            /* Type I error probability */
      vaxis    = -5 to 3
      odstitle = title
      markers
      nolegend;
   label Weight = 'Cumulative Sum';
   inset arl0 ualpha udelta h k umu0 shift sigmas / pos = sw;
run;
The ODS GRAPHICS ON statement specified before the PROC CUSUM statement enables ODS Graphics, so the cusum chart is created using ODS Graphics instead of traditional graphics.
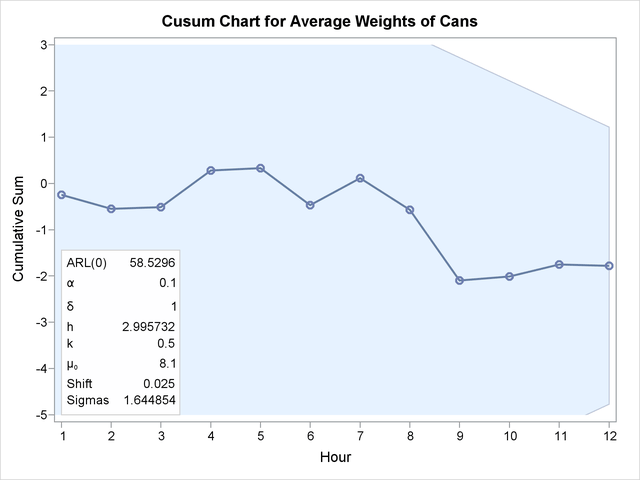
The resulting cusum chart is shown in Figure 6.15.
Figure 6.15: Two-Sided Cusum Chart with an Inset
