MACHART Statement: MACONTROL Procedure

Example 9.6 Specifying Standard Values for the Process Mean and Process Standard Deviation
See MACMA2 in the SAS/QC Sample LibraryBy default, the MACHART statement estimates the process mean (![]() ) and standard deviation (
) and standard deviation (![]() ) from the data. This is illustrated in the “Getting Started” section of this chapter. However, there are applications in which standard values (
) from the data. This is illustrated in the “Getting Started” section of this chapter. However, there are applications in which standard values (![]() and
and ![]() ) are available based, for instance, on previous experience or extensive sampling. You can specify these values with the MU0=
and SIGMA0= options.
) are available based, for instance, on previous experience or extensive sampling. You can specify these values with the MU0=
and SIGMA0= options.
For example, suppose it is known that the metal clip manufacturing process (introduced in Creating Moving Average Charts from Raw Data) has a mean of 15 and standard deviation of 0.2. The following statements specify these standard values:
ods graphics off;
symbol h = .8;
title 'Specifying Standard Process Mean and Standard Deviation';
proc macontrol data=Clips1;
   machart Gap*Day /
       mu0     = 15
       sigma0  = 0.2
       span    = 4
       xsymbol = mu0;
run;
The XSYMBOL= option specifies the label for the central line. The resulting chart is shown in Output 9.6.1.
Output 9.6.1: Specifying Standard Values with MU0= and SIGMA0=
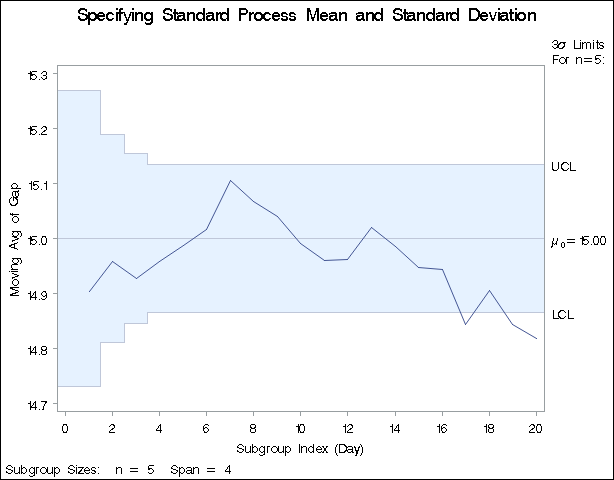
The central line and control limits are determined using ![]() and
and ![]() (see the equations in Table 9.9). Output 9.6.1 indicates that the process is out-of-control since the moving averages for
(see the equations in Table 9.9). Output 9.6.1 indicates that the process is out-of-control since the moving averages for Day=17, Day=19, and Day=20 lie below the lower control limit.
You can also specify ![]() and
and ![]() with the variables
with the variables _MEAN_ and _STDDEV_ in a LIMITS= data set, as illustrated by the following statements:
data cliplim;
   length _var_ _subgrp_ _type_ $8;
   _var_    = 'Gap';
   _subgrp_ = 'Day';
   _type_   = 'STANDARD';
   _limitn_ = 5;
   _mean_   = 15;
   _stddev_ = 0.2;
   _span_   = 4;
run;

proc macontrol data=Clips1 limits=Cliplim;
   machart Gap*Day / xsymbol=mu0;
run;
The variable _SPAN_ is required, and its value provides the number of terms in the moving average. The variables _VAR_ and _SUBGRP_ are also required, and their values must match the process and subgroup-variable, respectively, specified in the MACHART statement. The bookkeeping variable _TYPE_ is not required, but it is recommended to indicate that the variables _MEAN_ and _STDDEV_ provide standard values rather than estimated values.
The resulting chart (not shown here) is identical to the one shown in Output 9.6.1.