Getting Started: INSET Statement
This section introduces the INSET statement with a basic example showing how it is used. See INSET and INSET2 Statements: SHEWHART Procedure for a complete description of the INSET statement.
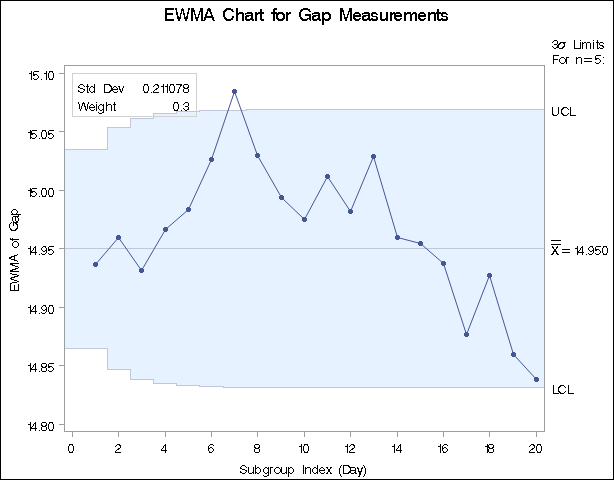
This example is based on the same scenario as the first example in the “Getting Started” section of EWMACHART Statement: MACONTROL Procedure. An EWMA chart is used to analyze data from the manufacture of metal clips. The following statements create a data set containing measurements to be analyzed and the EWMA chart shown in Figure 9.18.
data Clips1;
   input Day @ ;
   do i=1 to 5;
      input Gap @ ;
      output;
   end;
   drop i;
   datalines;
 1  14.76  14.82  14.88  14.83  15.23
 2  14.95  14.91  15.09  14.99  15.13
 3  14.50  15.05  15.09  14.72  14.97
 4  14.91  14.87  15.46  15.01  14.99
 5  14.73  15.36  14.87  14.91  15.25
 6  15.09  15.19  15.07  15.30  14.98
 7  15.34  15.39  14.82  15.32  15.23
 8  14.80  14.94  15.15  14.69  14.93
 9  14.67  15.08  14.88  15.14  14.78
10  15.27  14.61  15.00  14.84  14.94
11  15.34  14.84  15.32  14.81  15.17
12  14.84  15.00  15.13  14.68  14.91
13  15.40  15.03  15.05  15.03  15.18
14  14.50  14.77  15.22  14.70  14.80
15  14.81  15.01  14.65  15.13  15.12
16  14.82  15.01  14.82  14.83  15.00
17  14.89  14.90  14.60  14.40  14.88
18  14.90  15.29  15.14  15.20  14.70
19  14.77  14.60  14.45  14.78  14.91
20  14.80  14.58  14.69  15.02  14.85
;
title 'EWMA Chart for Gap Measurements';
symbol v=dot;
proc macontrol data=Clips1;
   ewmachart Gap*Day / weight = 0.3
                       nolegend;
   inset stddev weight;
run;
Figure 9.18: Exponentially Weighted Moving Average Chart with an Inset
