Default Labels
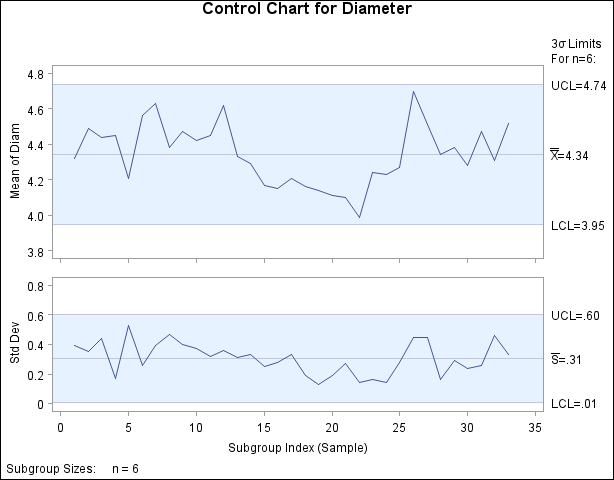
If a label is not associated with the subgroup-variable, the default horizontal axis label is “Subgroup Index (subgroup-variable).” The default vertical axis label for a primary chart identifies the chart type and the process variable. The default vertical axis label for a secondary chart identifies the chart type only.
For example, the following statements create ![]() and s charts with default labels using the data set
and s charts with default labels using the data set Parts given in Displaying Stratified Process Data. The resulting charts are displayed in Figure 17.171.
symbol v=none w=1;
title 'Control Chart for Diameter';
proc shewhart history=Parts;
   xschart Diam*Sample;
run;
Figure 17.171: Control Charts with Default Labels
