Additional Topics
Solving for Sample Size
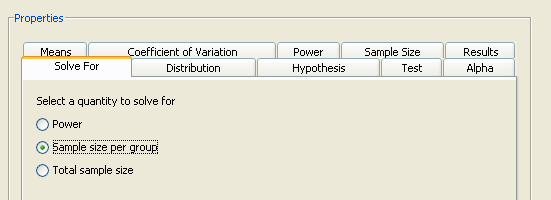
Several types of analysis enable you to solve for either total sample size or sample size per group. The sample size per group choice assumes equal group sizes. When solving for total sample size, the group sizes can be equal or unequal. Select the desired quantity on the Solve For tab. An example of these options is shown in Figure 72.57.
Figure 72.57: Solve For Tab with Sample Size Selected

For either of the two sample size options, you must specify one or more values for power on the Power tab. If you frequently use the same values for power, set them as the default in the Preferences window, which is accessed by →. Changing preferences affects only projects that you create after the change; existing projects are not affected.
If you select total sample size, you must specify whether the group sizes are equal or unequal. Select the appropriate option on the Sample Size tab. For unequal group sizes, you must specify the relative sample sizes for the two groups. For information about providing relative sample sizes, see the section Using Unequal Group Sizes.
Using Unequal Group Sizes
When solving for either power or total sample size, you might have unequal group sizes. If so, you must provide relative sample sizes for the groups. Weights must be greater than 0 but do not have to sum to 1.
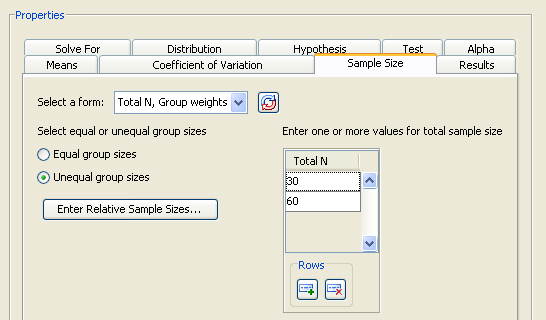
Select the form on the Sample Size tab. Enter total sample sizes of 30 and 60 in the Total N table. Select the option and click , as seen in Figure 72.58.
Figure 72.58: Sample Size Tab with Group Weights Form

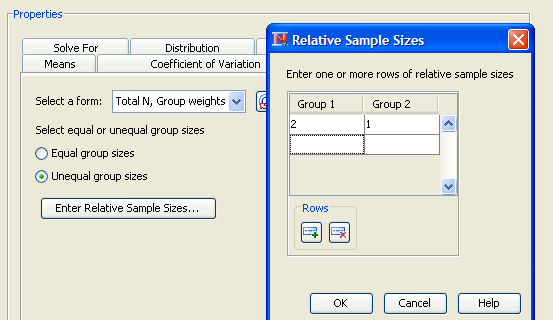
Figure 72.59 displays the window in which you can enter relative sample sizes. As an example, enter 2 for the first group and 1 for the second. In this case, you are sampling the drug treatment group twice as often as the control group.
Figure 72.59: Relative Sample Sizes Window

The weights control how the total sample size is divided between the two groups. In the example, the sample size for groups 1 and 2 is 20 and 10, respectively, for a total sample size of 30.
Click to save the values and return to the Edit Properties page.