Using the Output Delivery System
-
Overview

-
Examples
 Creating HTML Output with ODSSelecting ODS Tables for DisplayExcluding ODS Tables from DisplayCreating an Output Data Set from an ODS TableCreating an Output Data Set: Subsetting the DataRUN-Group ProcessingODS Output Data Sets and Using PROC TEMPLATE to Customize OutputHTML Output with Hyperlinks between TablesHTML Output with Graphics and HyperlinksCorrelation and Covariance Matrices
 - References
HTML Output in the SAS Windowing Environment
The default destination in the SAS windowing environment is HTML and ODS Graphics is enabled by default.[1] These defaults have several advantages. Graphs are integrated with tables, and all output is displayed in the same HTML file. The HTML destination uses the HTMLBLUE style, which is an all-color style, that is designed to integrate tables and modern statistical graphics.
You can view and modify the default settings by selecting ![]()
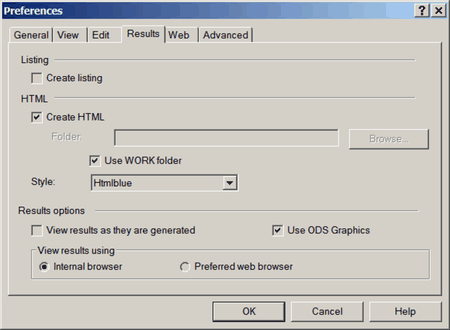
![]() from the menu at the top of the main SAS window. Then click the tab. You can remember this sequence using the mnemonic TOPR (pronounced “topper”). See Figure 20.1.
from the menu at the top of the main SAS window. Then click the tab. You can remember this sequence using the mnemonic TOPR (pronounced “topper”). See Figure 20.1.
Figure 20.1: SAS Results Tab with the Default Settings

The default settings are as follows:
-
HTML output is created when is selected, and all output is viewed in the Results Viewer window.
-
ODS Graphics is enabled when is selected.
-
Results are viewed in an internal SAS browser when is selected.
-
Graph image files are saved in the
Workfolder (not in your current folder) when is selected. -
LISTING output is not created when the box is cleared.
In many cases, graphs are an integral part of a data analysis. However, when you run large computational programs (such as when you use procedures with many BY groups), you might not want to create graphs. In those cases, you should disable ODS Graphics, which will improve the performance of your program. You can disable and re-enable ODS Graphics in your SAS programs with the ODS GRAPHICS OFF and ODS GRAPHICS ON statements. You can also change the ODS Graphics default in the tab.
In the SAS windowing environment, the current folder is displayed in the status line at the bottom of the main SAS window.
When is cleared, graph image files are saved in the current folder and are available after your SAS session ends. They can accumulate
with time and take up a great deal of space. When is selected, graph image files are stored in the Work folder and are not available after your SAS session ends.
[1] HTML output with ODS Graphics enabled is the default in the SAS windowing environment for Microsoft Windows and UNIX, but not on the mainframe.