The BOXPLOT Procedure
This section provides details on three different methods of positioning INSET boxes by using the POSITION= option. With the POSITION= option, you can specify the following:
-
compass points
-
keywords for margin positions
-
coordinates in data units or percent axis units
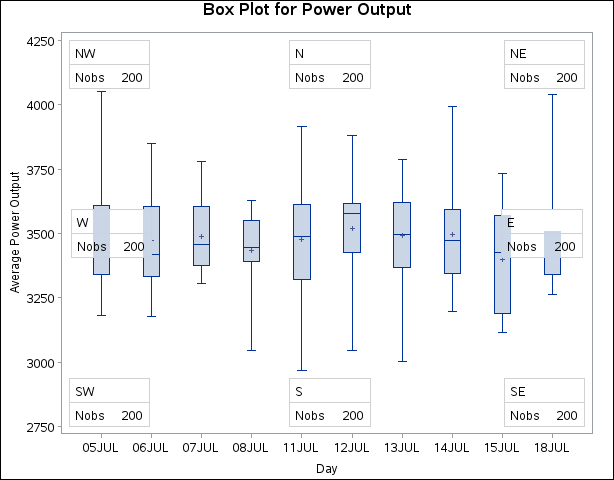
You can specify the eight compass points (N, NE, E, SE, S, SW, W, and NW) as keywords for the POSITION= option. The default inset position is NW. The following statements create the display in Figure 28.11, which illustrates all eight compass positions:
title 'Box Plot for Power Output';
proc boxplot data=Turbine;
   plot KWatts*Day;
   inset nobs / height=2.5 cfill=blank header='NW' pos=nw;
   inset nobs / height=2.5 cfill=blank header='N ' pos=n ;
   inset nobs / height=2.5 cfill=blank header='NE' pos=ne;
   inset nobs / height=2.5 cfill=blank header='E ' pos=e ;
   inset nobs / height=2.5 cfill=blank header='SE' pos=se;
   inset nobs / height=2.5 cfill=blank header='S ' pos=s ;
   inset nobs / height=2.5 cfill=blank header='SW' pos=sw;
   inset nobs / height=2.5 cfill=blank header='W ' pos=w ;
run;
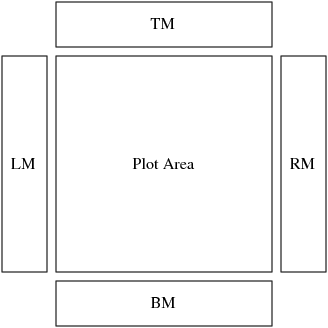
You can also use the INSET statement to position an inset in one of the four margins surrounding the plot area by using the margin keyword LM, RM, TM, or BM, as illustrated in Figure 28.12.
For an example of an inset placed in the top margin, see Output 28.1.1. Margin positions are recommended for insets containing a large number of statistics. If you attempt to display a lengthy inset in the interior of the plot, it is likely that the inset will collide with the data display.
You can also specify the position of an inset with coordinates by using the POSITION![]() option. You can specify coordinates in axis percent units (the default) or in axis data units.
option. You can specify coordinates in axis percent units (the default) or in axis data units.
If you specify the DATA option immediately following the coordinates, the inset is positioned using axis data units. For example, the following statements place the bottom-left corner of the inset at 07JUL on the horizontal axis and 3950 on the vertical axis:
title 'Box Plot for Power Output';
proc boxplot data=Turbine;
   plot KWatts*Day;
   inset nobs /
      header   = 'Position=(07JUL,3950)'
      position = ('07JUL94'd, 3950) data;
run;
The box plot is displayed in Figure 28.13. By default, the specified coordinates determine the position of the bottom-left corner of the inset. You can change this reference point with the REFPOINT= option, as in the next example.
If you do not use the DATA option, the inset is positioned using axis percent units. The coordinates of the bottom-left corner
of the display are ![]() , while the coordinates of the top-right corner are
, while the coordinates of the top-right corner are ![]() . For example, the following statements create a box plot with two insets, both positioned using coordinates in axis percent
units:
. For example, the following statements create a box plot with two insets, both positioned using coordinates in axis percent
units:
title 'Box Plot for Power Output';
proc boxplot data=Turbine;
   plot KWatts*Day;
   inset nmin / position = (5,25)
                header   = 'Position=(5,25)'
                height   = 3
                cfill    = ywh
                refpoint = tl;
   inset nmax / position = (95,95)
                header   = 'Position=(95,95)'
                height   = 3
                cfill    = ywh
                refpoint = tr;
run;
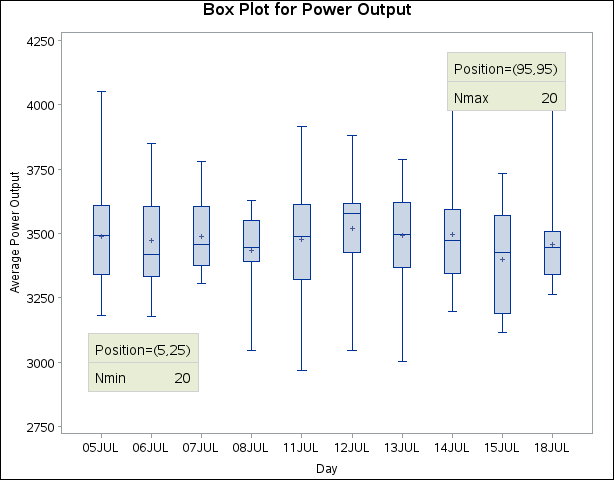
The display is shown in Figure 28.14. Notice that the REFPOINT= option is used to determine which corner of the inset is placed at the coordinates specified with the POSITION= option. The first inset has REFPOINT=TL, so the top-left corner of the inset is positioned 5% of the way across the horizontal axis and 25% of the way up the vertical axis. The second inset has REFPOINT=TR, so the top-right corner of the inset is positioned 95% of the way across the horizontal axis and 95% of the way up the vertical axis. Note also that coordinates in axis percent units must be between 0 and 100.


