The SIMILARITY Procedure
- Overview
- Getting Started
-
Syntax

-
Details
 AccumulationMissing Value InterpretationZero Value InterpretationTime Series TransformationTime Series DifferencingTime Series Missing Value TrimmingTime Series Descriptive StatisticsInput and Target SequencesSliding SequencesTime WarpingSequence NormalizationSequence ScalingSimilarity MeasuresUser-Defined Functions and SubroutinesOutput Data SetsOUT= Data SetOUTMEASURE= Data SetOUTPATH= Data SetOUTSEQUENCE= Data SetOUTSUM= Data Set_STATUS_ Variable ValuesPrinted OutputODS Table NamesODS Graphics
 -
Examples

- References
This example illustrates how to search for historical analogies by using seasonal sliding similarity analysis of transactional
time-stamped data. The SASHELP.TIMEDATA data set contains the variable (VOLUME), which represents activity over time. The following statements create an example data set that contains two time series
of differing lengths, where the variable HISTORY represents the historical activity and RECENT represents the more recent activity:
data timedata; set sashelp.timedata;
   drop volume;
   recent  = .;
   history = volume;
   if datetime >= '20AUG2000:00:00:00'DT then do;
      recent  = volume;
      history = .;
   end;
run;
The goal of seasonal sliding similarity measures is to find the seasonal slide index that corresponds to the most similar seasonal subsequence of the input series when compared to the target sequence. The following statements perform similarity analysis on the example data set with seasonal sliding:
proc similarity data=timedata out=_NULL_ outsequence=sequences
                outsum=summary;
   id datetime interval=dtday accumulate=total
               start='27JUL1997:00:00:00'dt
               end='21OCT2000:11:59:59'DT;
   input history / normalize=absolute;
   target recent / slide=season normalize=absolute measure=mabsdev;
run;
The DATA=TIMEDATA option specifies that the input data set WORK.TIMEDATA be used in the analysis. The OUT=_NULL_ option specifies that no output time series data set is to be created. The OUTSEQUENCE=SEQUENCES
and OUTSUM=SUMMARY options specify the output sequences and summary data sets, respectively. The ID statement specifies that
the time ID variable is DATETIME, which is to be accumulated on a daily basis (INTERVAL=DTDAY) by summing the transactions (ACCUMULATE=TOTAL). The ID statement
also specifies that the data is accumulated on the weekly boundaries starting on the week of 27JUL1997 and ending on the week
of 15OCT2000 (START=’27JUL1997:00:00:00’DT END=’21OCT2000:11:59:59’DT). The INPUT statement specifies that the input variable
is HISTORY, which is to be normalized using absolute normalization (NORMALIZE=ABSOLUTE). The TARGET statement specifies that the target
variable is RECENT, which is to be normalized by using absolute normalization (NORMALIZE=ABSOLUTE) and that the similarity measure be computed
by using mean absolute deviation (MEASURE=MABSDEV). The SLIDE=SEASON options specifies season index sliding.
To illustrate the results of the similarity analysis, the output sequence data set must be subset by using the output summary data set.
data _NULL_; set summary;
   call symput('MEASURE', left(trim(putn(recent,'BEST20.'))));
run;

data result; set sequences;
   by _SLIDE_;
   retain flag 0;
   if first._SLIDE_  then do;
      if (&measure - 0.00001 < _SIM_ < &measure + 0.00001)
      then flag = 1;
   end;
   if flag then output;
   if last._SLIDE_ then flag = 0;
run;
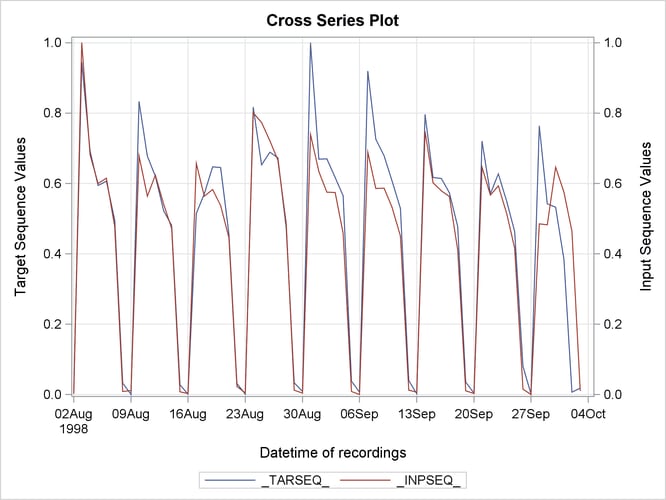
The following statements generate a cross series plot of the results:
proc timeseries data=result out=_NULL_ crossplot=series;
   id datetime interval=dtday;
   var _TARSEQ_;
   crossvar _INPSEQ_;
run;
The cross series plot illustrates that the historical time series analogy most similar to the most recent time series data that started on 20AUG2000 occurred on 02AUG1998.
