Examples: Creating Interactive Java Output
About These Examples
Example: Local Drill-Down Mode with Java
Here is an example
that generates an HTML output file that runs the Graph applet. If
the graph contains a group or subgroup, then by default the applet
automatically provides drill-down functionality. When a user clicks
on an element in the graph, the applet generates and displays a new
graphic based on the selected elements. In the example, note how variable
roles are assigned in the VBAR3D statement.
This example is available
in the Sample Library under the name GWBJALOC. For further information,
see Links in ACTIVEX Presentations.
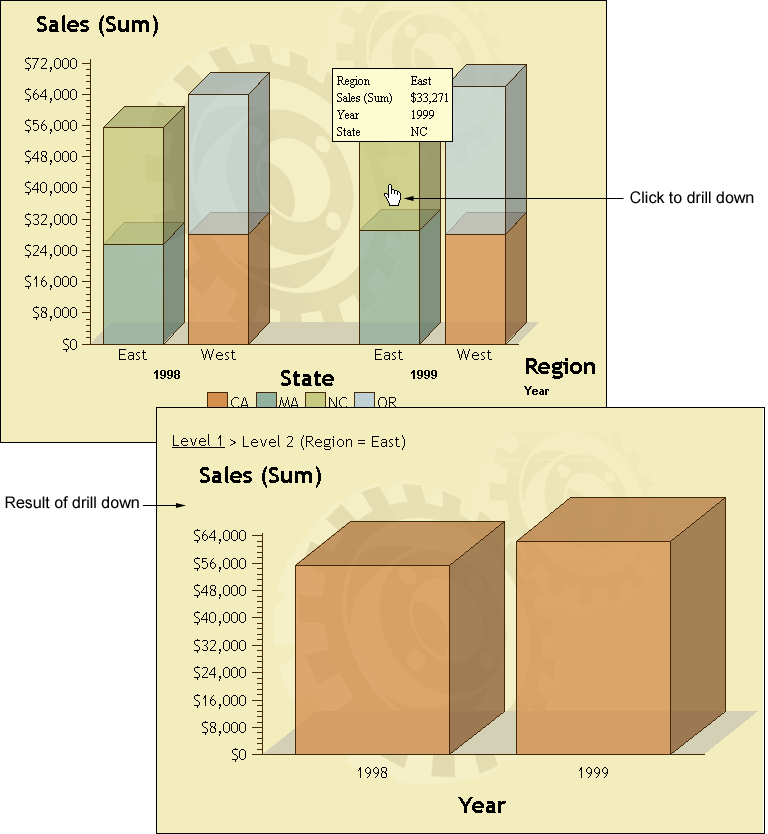
The following picture
shows output produced by the sample program. The top of the picture
shows the initial graph. The bottom of the picture shows the graph
that results from a user clicking on a portion of the initial graph.
Here is the example
program code.
filename odsout "sales.htm";

/* Close the current ODS HTML destination. */
ods html close;

data sales;
   length Region $ 4 State $ 2;
   format Sales dollar8.;
   input Region State Sales Year Qtr;
   datalines;
West CA 13636 1999 1
West OR 18988 1999 1
West CA 14523 1999 2
West OR 18988 1999 2
East MA 18038 1999 1
East NC 13611 1999 1
East MA 11084 1999 2
East NC 19660 1999 2
West CA 12536 1998 1
West OR 17888 1998 1
West CA 15623 1998 2
West OR 17963 1998 2
East NC 17638 1998 1
East MA 12811 1998 1
East NC 12184 1998 2
East MA 12760 1998 2
;
goptions reset=all device=java;

ods html file=odsout style=gears;

title "Company Sales, Mid Year";

proc gchart data=sales;
   vbar3d region / sumvar=sales
   group=year subgroup=state;
run; quit;

ods html close;
ods html;
You
can also use the URL= procedure option to implement local drill-down
links in your graphs. See Adding Links and Enhancements with the URL=, HTML=, and HTML_LEGEND= Options.
Example: Script Drill-Down Mode with Java
Here is an example that
shows how to implement the script drill-down mode in the Graph applet
or Map applet. SAS/GRAPH
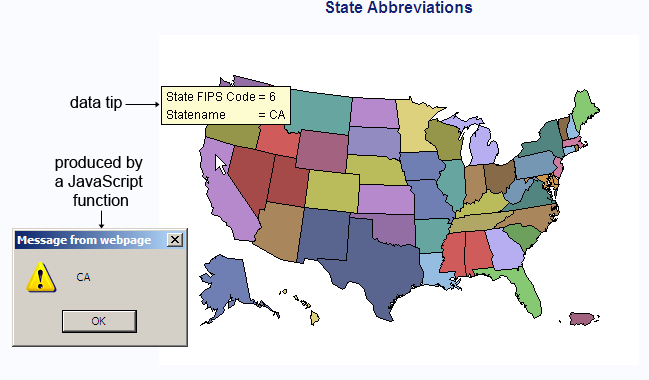
provides data tips by default. These data tips are displayed when
the cursor is over a portion of the map. To implement JavaScript drill-down
functionality, PUT statements are used to insert JavaScript code into
the HTML file. The JavaScript, in the example, opens an alert window
that displays the state abbreviation.
This example is available
in the Sample Library under the name GWBSCDRL. For further information,
see Links in ACTIVEX Presentations.
/* Change the next two lines to run this program. */
filename odsout "states.htm" ;

/* If your site has already installed the map data sets and           */
/* defined the MAPS libref, then you can delete the LIBNAME statement */
/* below and the sample code will work.        */
/* If not, contact your on-site SAS support personnel */
/* to determine how to define the MAPS libref. */
*libname maps 'SAS-MAPS-library';

/* Create a data set that contains the US states. */
proc sql;
create table work.mydata as
select unique state from maps.us;
quit;

/* Add state abbreviations to the new data set. */
data work.mydata;
 length Statename $2;
 set work.mydata;
 Statename=trim(left(upcase(fipstate(state))));
run;

/* Specify the JAVA device. */
goptions reset=all device=java;

/* Close the current ODS HTML destination. */
ods html close;

/* Open ODS HTML and specify the HTML output file, the script  */
/* drill-down mode, and the callback method. */
ods html file=odsout
         parameters=("DRILLDOWNMODE"="Script"
                     "DRILLFUNC"="MapDrill");

/* Specify a map title and generate the map. */
title1 "State Abbreviations";
proc gmap map=maps.us data=work.mydata all;
   id state;
   choro statename / nolegend;
run;
quit;

/* Close ODS HTML to close the output file, and then reopen ODS HTML. */
ods html close;
ods html;

/* Create the MapDrill script that is specified on */
/* the ODS HTML statement's DRILLFUNC parameter.   */
/* Write the script to the same file that contains */
/* the HTML output from the GMAP procedure.        */
data _null_ ;
file odsout mod; /* Modify the file rather than replacing it. */
put " " ;
put "<SCRIPT LANGUAGE='JavaScript'>" ;
put "function MapDrill( appletref )" ;
put "{" ;
put " " ;
put "/* Open an alert box to show the abbreviated state name. */ " ;
put "for(i = 2; i < MapDrill.arguments.length; i += 2)" ;
put "  {" ;
put "    if (MapDrill.arguments[i] == 'G_DEPV,f' )";
put "        alert(MapDrill.arguments[i+1]);" ;
put "  }" ;
put " " ;
put "}" ;
put "</SCRIPT>";
run ;
Example: URL Drill-Down Mode with Java
Here is an example
that demonstrates the URL drill-down mode. This example is available
in the SAS sample library under the name GWBURLDR. For further information,
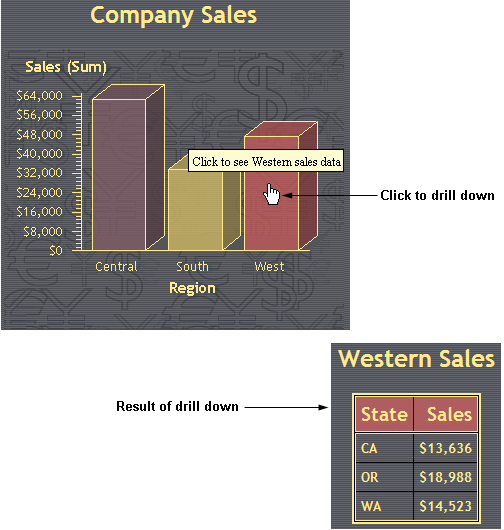
see Links in JAVA Presentations. This example generates a drill-down bar chart of regional
sales data as shown in the following figure.
Clicking on any one
of the bars in the bar chart opens the corresponding HTML file that
displays a table further breaking down the sales data. To create the
drill-down chart, a link information variable, RPT, is added to the
data set to contain the HREF=url and
the TITLE=tool-tip-text attributes
for each region bar in the chart. ODS inserts these attributes into
the image map for the graph when it generates the HTML output. Because
the RPT variable includes the HREF= and TITLE= attributes, the HTML=
option must be used in the GPLOT statement to specify the RPT variable.
The URL= option cannot be used in this case.
Here is the example
program code.
/* Change web-output-path in the following macro variable
   definition to a valid output path. */
%let outpath=web-output-path;

/* Define the output directory and file references */
filename urldrill "&outpath"; /* Path to the output files */
filename sales "&outpath/sales.html";
filename central "&outpath/central.html";
filename south "&outpath/south.html";
filename west "&outpath/west.html";

/* Close the current ODS HTML destination. */
ods html close;

/* Specify the device. */
goptions reset=all device=java;

/* Create the data set REGSALES. */
data regsales;
   length Region State $ 8;
   format Sales dollar8.;
   input Region State Sales;

/* Initialize the link variable. */
   length rpt $150;

/* Assign values to the HTML variable. */
if Region="Central" then
      rpt='href="central.html" title="Click to see Central sales data"';
   else if Region="South" then
      rpt='href="south.html" title="Click to see Southern sales data"';
   else if Region="West" then
      rpt='href="west.html" title="Click to see Western sales data"';

datalines;
West CA 13636
West OR 18988
West WA 14523
Central IL 18038
Central IN 13611
Central OH 11084
Central MI 19660
South FL 14541
South GA 19022
;

/* Open the HTML output file and specify the URL drill-down mode. */
ods html body=sales
    path=urldrill
    style=money
    parameters=("drilldownmode"="url");

/* Create a chart that uses the link variable. */
title "Company Sales";
proc gchart data=regsales;
   vbar3d region / sumvar=sales
   patternid=midpoint
   html=rpt; /* Set the HTML variable to rpt */
run;
quit;

/* Create an HTML file for Central sales. */
ods html body=central path=urldrill style=money;
title "Central Sales";
proc print data=regsales noobs;
   var state sales;
   where region="Central";
run;

/* Create an HTML file for Southern sales */
ods html body=south path=urldrill style=money;
title "Southern Sales";
proc print data=regsales noobs;
   var state sales;
   where region="South";
run;

/* Create an HTML file for Western sales. */
ods html body=west  path=urldrill style=money;
title1 "Western Sales";
proc print data=regsales noobs;
   var state sales;
   where region="West";
run;
quit;

/* Close ODS HTML to close the output file, and then reopen ODS HTML. */
ods html close;
ods html;
Example: HTML Drill-Down Mode
Here is an example that
generates an HTML output file that displays the Map applet. The applet
is configured for the HTML drill-down mode, where URLs are dynamically
generated based on the data in the graph element that was selected
in the drill-down action. In this example, the value of the STATENAME
variable is used to complete the URLs. For additional information,
see Links in ACTIVEX Presentations.
In the resulting HTML
page, clicking on a state in the U.S. map activates a URL. This example
is available in the SAS Sample Library under the name GWBJAMAP. Here
is the example program code.
/* Close the current ODS HTML destination.     */

ods html close;

/* Specify a path and name for the HTML output file.  */

 ods html
   file="your_HTML_file.htm"
    style=default
    parameters=("DRILLDOWNMODE"="HTML")
    parameters=("DRILLPATTERN"="http://www.state.{&statename}.us")
    parameters=("BACKCOLOR"="FFFFFF");

/* Specify the JAVA device and set up customizations.       */

goptions reset=all device=java;

/* Create data for the graph. */

proc sql;
   create table work.mydata as
   select unique state from maps.us;
   quit;
   run;
data work.mydata;
   length statename $1020;
   set work.mydata;

/* Place the state name in the data set. */

   statename=trim(left(lowcase(fipstate(state))));
   run;

title1
   "Click on a state to go to that state's home page";

/* Generate the graph. */

proc gmap map=maps.us
   data=work.mydata all;
   id state;
   choro statename / levels=1 discrete
         coutline=black
         nolegend
         des="US Government Web Sites"
         name="usgov";
    run; quit;

/* Close ODS HTML to close the output file, and then reopen ODS HTML. */

ods html close;
ods html;

