TIMEPLOT Procedure

Example 4: Superimposing Two Plots

Features:

PROC TIMEPLOT statement options: : MAXDEC=

PLOT statement arguments: :
using two types of plot requests
OVERLAY
REF=MEAN(variable(s))
REVERSE
Data set: SALES

Details

This example demonstrates the following:
  • Superimpose two plots on one set of axes
  • Specify a variable to use as the plotting symbol for one plot and a character to use as the plotting symbol for the other plot
  • Draw a reference line to the mean value of each of the two variables plotted
  • Reverse the labeling of the axis so that the largest value is at the far left of the plot

Program

options formchar="|----|+|---+=|-/\<>*";
proc timeplot data=sales maxdec=0;
   plot stove=seller icebox='R' /
          overlay
            ref=mean(stove icebox)
                                 
reverse;
   label icebox='Refrigerators';
   title 'Weekly Sales of Stoves and Refrigerators';
   title2 'for the';
   title3 'First Six Weeks of the Year';
run;

Program Description

Set the FORMCHAR option.Setting FORMCHAR to this exact string renders better HTML output when it is viewed outside of the SAS environment where SAS Monospace fonts are not available.
options formchar="|----|+|---+=|-/\<>*";
Specify the number of decimal places to display. MAXDEC= specifies the number of decimal places to display in the listing.
proc timeplot data=sales maxdec=0;
Plot sales of both stoves and refrigerators.The PLOT statement requests two plots. One plot uses the first letter of the formatted value of Seller to plot the values of Stove. The other uses the letter R (to match the label Refrigerators) to plot the value of Icebox.
   plot stove=seller icebox='R' /
Print both plots on the same set of axes.
          overlay
Create two reference lines on the plot. REF= draws two reference lines: one perpendicular to the mean of Stove, the other perpendicular to the mean of Icebox.
            ref=mean(stove icebox)
Order the values on the horizontal axis from largest to smallest.
                                 
reverse;
Apply a label to the sales column in the listing. The LABEL statement associates a label with the variable Icebox for the duration of the PROC TIMEPLOT step. PROC TIMEPLOT uses the label as the column heading in the listing.
   label icebox='Refrigerators';
Specify the titles.
   title 'Weekly Sales of Stoves and Refrigerators';
   title2 'for the';
   title3 'First Six Weeks of the Year';
run;

Output

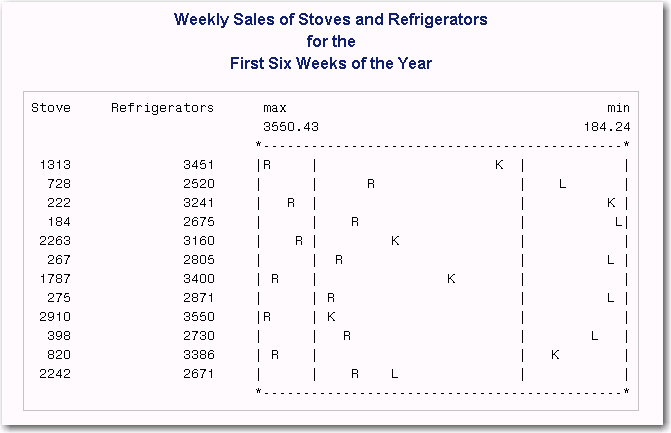
The column heading for the variable Icebox in the listing is the variable's label (Refrigerators). One plot uses the first letter of the value of Seller as the plotting symbol. The other plot uses the letter R.
Two Plots Superimposed Using Different Plotting Symbols
Weekly Sales of Stoves and Refrigerators for the First Six Weeks of the Year