The VARMAX Procedure
- Overview
-
Getting Started

-
Syntax
-
DetailsMissing ValuesVARMAX ModelDynamic Simultaneous Equations ModelingImpulse Response FunctionForecastingTentative Order SelectionVAR and VARX ModelingBayesian VAR and VARX ModelingVARMA and VARMAX ModelingModel Diagnostic ChecksCointegrationVector Error Correction ModelingI(2) ModelMultivariate GARCH ModelingOutput Data SetsOUT= Data SetOUTEST= Data SetOUTHT= Data SetOUTSTAT= Data SetPrinted OutputODS Table NamesODS GraphicsComputational Issues
-
Examples
- References
The VARX(![]() ,
,![]() ) model can be written in the error correction form:
) model can be written in the error correction form:
Let ![]() .
.
If ![]() and
and ![]() have full-rank
have full-rank ![]() , and
, and ![]() , then
, then ![]() is an
is an ![]() process.
process.
If the condition ![]() fails and
fails and ![]() has reduced-rank
has reduced-rank ![]() where
where ![]() and
and ![]() are
are ![]() matrices with
matrices with ![]() , then
, then ![]() and
and ![]() are defined as
are defined as ![]() matrices of full rank such that
matrices of full rank such that ![]() and
and ![]() .
.
If ![]() and
and ![]() have full-rank
have full-rank ![]() , then the process
, then the process ![]() is
is ![]() , which has the implication of
, which has the implication of ![]() model for the moving-average representation.
model for the moving-average representation.
The matrices ![]() ,
, ![]() , and
, and ![]() are determined by the cointegration properties of the process, and
are determined by the cointegration properties of the process, and ![]() and
and ![]() are determined by the initial values. For details, see Johansen (1995b).
are determined by the initial values. For details, see Johansen (1995b).
The implication of the ![]() model for the autoregressive representation is given by
model for the autoregressive representation is given by
where ![]() and
and ![]() .
.
The ![]() cointegrated model is given by the following parameter restrictions:
cointegrated model is given by the following parameter restrictions:
where ![]() and
and ![]() are
are ![]() matrices with
matrices with ![]() . Let
. Let ![]() represent the
represent the ![]() model where
model where ![]() and
and ![]() have full-rank
have full-rank ![]() , let
, let ![]() represent the
represent the ![]() model where
model where ![]() and
and ![]() have full-rank
have full-rank ![]() , and let
, and let ![]() represent the
represent the ![]() model where
model where ![]() and
and ![]() have rank
have rank ![]() . The following table shows the relation between the
. The following table shows the relation between the ![]() models and the
models and the ![]() models.
models.
Johansen (1995b) proposed the two-step procedure to analyze the ![]() model. In the first step, the values of
model. In the first step, the values of ![]() are estimated using the reduced rank regression analysis, performing the regression analysis
are estimated using the reduced rank regression analysis, performing the regression analysis ![]() ,
, ![]() , and
, and ![]() on
on ![]() and
and ![]() . This gives residuals
. This gives residuals ![]() ,
, ![]() , and
, and ![]() , and residual product moment matrices
, and residual product moment matrices
Perform the reduced rank regression analysis ![]() on
on ![]() corrected for
corrected for ![]() ,
, ![]() and
and ![]() , and solve the eigenvalue problem of the equation
, and solve the eigenvalue problem of the equation
where ![]() for
for ![]() .
.
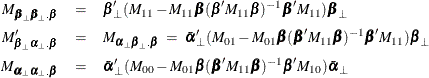
In the second step, if ![]() are known, the values of
are known, the values of ![]() are determined using the reduced rank regression analysis, regressing
are determined using the reduced rank regression analysis, regressing ![]() on
on ![]() corrected for
corrected for ![]() , and
, and ![]() .
.
The reduced rank regression analysis reduces to the solution of an eigenvalue problem for the equation
where
where ![]() .
.
The solution gives eigenvalues ![]() and eigenvectors
and eigenvectors ![]() . Then, the ML estimators are
. Then, the ML estimators are
The likelihood ratio test for the reduced rank model ![]() with rank
with rank ![]() in the model
in the model ![]() is given by
is given by
The following statements compute the rank test to test for cointegrated order 2:
proc varmax data=simul2;
   model y1 y2 / p=2 cointtest=(johansen=(iorder=2));
run;
The last two columns in Figure 35.60 explain the cointegration rank test with integrated order 1. The results indicate that there is the cointegrated relationship
with the cointegration rank 1 with respect to the 0.05 significance level because the test statistic of 0.5552 is smaller
than the critical value of 3.84. Now, look at the row associated with ![]() . Compare the test statistic value, 211.84512, to the critical value, 3.84, for the cointegrated order 2. There is no evidence
that the series are integrated order 2 at the 0.05 significance level.
. Compare the test statistic value, 211.84512, to the critical value, 3.84, for the cointegrated order 2. There is no evidence
that the series are integrated order 2 at the 0.05 significance level.
Figure 35.60: Cointegrated I(2) Test (IORDER= Option)
| Cointegration Rank Test for I(2) | ||||
|---|---|---|---|---|
| r\k-r-s | 2 | 1 | Trace of I(1) |
5% CV of I(1) |
| 0 | 720.40735 | 308.69199 | 61.7522 | 15.34 |
| 1 | 211.84512 | 0.5552 | 3.84 | |
| 5% CV I(2) | 15.34000 | 3.84000 | ||