PLOT Procedure
- Syntax

- Overview
- Concepts
- Results
- Examples
 Specifying a Plotting SymbolControlling the Horizontal Axis and Adding a Reference LineOverlaying Two PlotsProducing Multiple Plots per PagePlotting Data on a Logarithmic ScalePlotting Date Values on an AxisProducing a Contour PlotPlotting BY GroupsAdding Labels to a PlotExcluding Observations That Have Missing ValuesAdjusting Labels on a Plot with the PLACEMENT= OptionAdjusting Labeling on a Plot with a MacroChanging a Default Penalty
Example 6: Plotting Date Values on an Axis
| Features: |
PLOT statement option:: HAXIS= |
Program
options formchar="|----|+|---+=|-/\<>*";
data emergency_calls;
   input Date : date7. Calls @@;
   label calls='Number of Calls';
   datalines;
1APR94 134   11APR94 384  13FEB94 488
2MAR94 289   21MAR94 201  14MAR94 460
3JUN94 184   13JUN94 152  30APR94 356
4JAN94 179   14JAN94 128  16JUN94 480
5APR94 360   15APR94 350  24JUL94 388
6MAY94 245   15DEC94 150  17NOV94 328
7JUL94 280   16MAY94 240  25AUG94 280
8AUG94 494   17JUL94 499  26SEP94 394
9SEP94 309   18AUG94 248  23NOV94 590
19SEP94 356  24FEB94 201  29JUL94 330
10OCT94 222  25MAR94 183  30AUG94 321
11NOV94 294  26APR94 412   2DEC94 511
27MAY94 294  22DEC94 413  28JUN94 309
;
proc plot data=emergency_calls;
   plot calls*date / haxis='1JAN94'd to '1JAN95'd by month vaxis=by 100 vspace=5;
format date mmyyd5.;
   title 'Calls to City Emergency Services Number';
   title2 'Sample of Days for 1994';
run;
Program Description
Set the FORMCHAR option.Setting
FORMCHAR to this exact string renders better HTML output when it is
viewed outside of the SAS environment where SAS Monospace fonts are
not available.
Create the EMERGENCY_CALLS data set. EMERGENCY_CALLS contains the number of telephone
calls to an emergency help line for each date.
data emergency_calls;
   input Date : date7. Calls @@;
   label calls='Number of Calls';
   datalines;
1APR94 134   11APR94 384  13FEB94 488
2MAR94 289   21MAR94 201  14MAR94 460
3JUN94 184   13JUN94 152  30APR94 356
4JAN94 179   14JAN94 128  16JUN94 480
5APR94 360   15APR94 350  24JUL94 388
6MAY94 245   15DEC94 150  17NOV94 328
7JUL94 280   16MAY94 240  25AUG94 280
8AUG94 494   17JUL94 499  26SEP94 394
9SEP94 309   18AUG94 248  23NOV94 590
19SEP94 356  24FEB94 201  29JUL94 330
10OCT94 222  25MAR94 183  30AUG94 321
11NOV94 294  26APR94 412   2DEC94 511
27MAY94 294  22DEC94 413  28JUN94 309
;
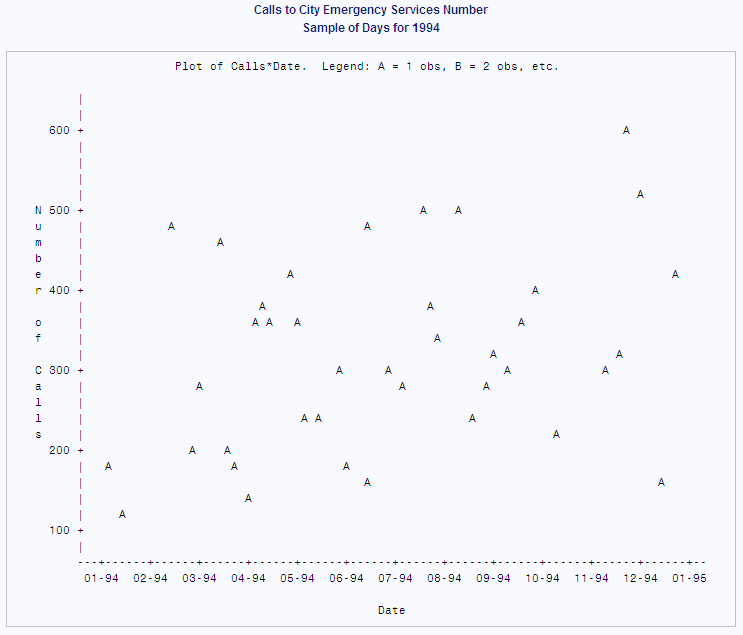
Create the plot. The plot
request plots Calls on the vertical axis and Date on the horizontal
axis. HAXIS= uses a monthly time for the horizontal axis. The notation '1JAN94'd
is a date constant. The value '1JAN95'd
ensures that the axis will have enough room for observations from
December.
proc plot data=emergency_calls;
   plot calls*date / haxis='1JAN94'd to '1JAN95'd by month vaxis=by 100 vspace=5;
